Pfizer 2010 Annual Report Download - page 93
Download and view the complete annual report
Please find page 93 of the 2010 Pfizer annual report below. You can navigate through the pages in the report by either clicking on the pages listed below, or by using the keyword search tool below to find specific information within the annual report.-
 1
1 -
2
-
3
-
4
-
5
-
6
-
7
-
8
-
9
-
10
-
11
-
12
-
13
-
14
-
15
-
16
-
17
-
18
-
19
-
20
-
21
-
22
-
23
-
24
-
25
-
26
-
27
-
28
-
29
-
30
-
31
-
32
-
33
-
34
-
35
-
36
-
37
-
38
-
39
-
40
-
41
-
42
-
43
-
44
-
45
-
46
-
47
-
48
-
49
-
50
-
51
-
52
-
53
-
54
-
55
-
56
-
57
-
58
-
59
-
60
-
61
-
62
-
63
-
64
-
65
-
66
-
67
-
68
-
69
-
70
-
71
-
72
-
73
-
74
-
75
-
76
-
77
-
78
-
79
-
80
-
81
-
82
-
 83
83 -
 84
84 -
 85
85 -
 86
86 -
 87
87 -
 88
88 -
 89
89 -
 90
90 -
 91
91 -
 92
92 -
 93
93 -
 94
94 -
 95
95 -
 96
96 -
 97
97 -
 98
98 -
 99
99 -
 100
100 -
 101
101 -
 102
102 -
 103
103 -
104
-
105
-
106
-
107
-
108
-
109
-
110
-
111
-
112
-
113
-
114
-
115
-
116
-
117
-
118
-
119
-
120
 |
 |

Notes to Consolidated Financial Statements
Pfizer Inc. and Subsidiary Companies
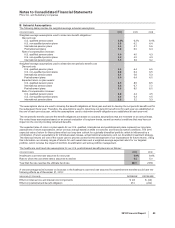
•Global equity securities—quoted market prices.
•Government bonds, Corporate debt securities—observable market prices.
•Other investments—principally unobservable prices adjusted by cash contributions and distributions.
A single estimate of fair value for our pension and postretirement plans’ assets relies heavily on estimates and assumptions (see
Note 1C. Significant Accounting Policies: Estimates and Assumptions).
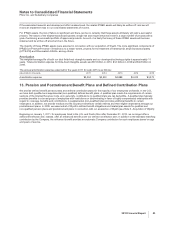
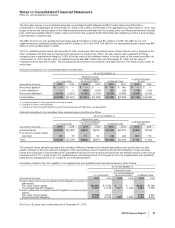
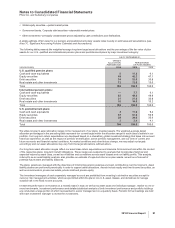
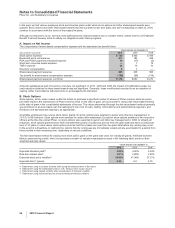
The following table presents the weighted-average long-term target asset allocations and the percentage of the fair value of plan
assets for our U.S. qualified and international pension plans and postretirement plans by major investment category:
AS OF DECEMBER 31,
TARGET
ALLOCATION
PERCENTAGE
PERCENTAGE
OF PLAN ASSETS
(PERCENTAGES) 2010 2010 2009
U.S. qualified pension plans:
Cash and cash equivalents 5 11.3 6.1
Equity securities 49 42.2 47.1
Debt securities 34 33.6 33.8
Real estate and other investments 12 12.9 13.0
Total 100 100.0 100.0
International pension plans:
Cash and cash equivalents — 7.7 6.1
Equity securities 53 49.8 49.9
Debt securities 31 31.6 33.8
Real estate and other investments 16 10.9 10.2
Total 100 100.0 100.0
U.S. postretirement plans:
Cash and cash equivalents 2 11.0 9.4
Equity securities 57 51.0 50.9
Debt securities 38 34.6 35.6
Real estate and other investments 3 3.4 4.1
Total 100 100.0 100.0
We utilize long-term asset allocation ranges in the management of our plans’ invested assets. The weighted-average target
allocation percentages in the preceding table represent our current target within the allocation range for each class of assets in our
portfolio. Our long-term return expectations are developed based on a diversified, global investment strategy that takes into account
historical experience, as well as the impact of portfolio diversification, active portfolio management, and our view of current and
future economic and financial market conditions. As market conditions and other factors change, we may adjust our targets
accordingly and our asset allocations may vary from the target allocations outlined above.
Our long-term asset allocation ranges reflect our asset class return expectations and tolerance for investment risk within the context
of the respective plans’ long-term benefit obligations. These ranges are supported by analysis that incorporates historical and
expected returns by asset class, as well as volatilities and correlations across asset classes and our liability profile. This analysis,
referred to as an asset-liability analysis, also provides an estimate of expected returns on plan assets, as well as a forecast of
potential future asset and liability balances.
The plans’ assets are managed with the objectives of minimizing pension expense and cash contributions over the long term. Asset
liability studies are performed periodically in order to support asset allocations. Assets include equity and fixed income securities, as
well as investments in private real estate, private debt and private equity.
The investment managers of each separately managed account are prohibited from investing in derivative securities except for
currency risk management activities, which are permitted within the plans’ non-U.S. asset classes, and derivatives to manage
duration risk in the fixed income accounts.
Investment performance is reviewed on a monthly basis in total, as well as by asset class and individual manager, relative to one or
more benchmarks. Investment performance and detailed statistical analysis of both investment performance and portfolio holdings
are conducted, a large portion of which is presented to senior management on a quarterly basis. Periodic formal meetings are held
with each investment manager to review the investments.
2010 Financial Report 91