Pfizer 2008 Annual Report Download - page 98
Download and view the complete annual report
Please find page 98 of the 2008 Pfizer annual report below. You can navigate through the pages in the report by either clicking on the pages listed below, or by using the keyword search tool below to find specific information within the annual report.-
 1
1 -
2
-
3
-
4
-
5
-
6
-
7
-
8
-
9
-
10
-
11
-
12
-
13
-
14
-
15
-
16
-
17
-
18
-
19
-
20
-
21
-
22
-
23
-
24
-
25
-
26
-
27
-
28
-
29
-
30
-
31
-
32
-
33
-
34
-
35
-
36
-
37
-
38
-
39
-
40
-
41
-
42
-
43
-
44
-
45
-
46
-
47
-
48
-
49
-
50
-
51
-
52
-
53
-
54
-
55
-
56
-
57
-
58
-
59
-
60
-
61
-
62
-
63
-
64
-
65
-
66
-
67
-
68
-
69
-
70
-
71
-
72
-
73
-
74
-
75
-
76
-
77
-
78
-
79
-
80
-
81
-
82
-
83
-
84
-
85
-
86
-
87
-
 88
88 -
 89
89 -
 90
90 -
 91
91 -
 92
92 -
 93
93 -
 94
94 -
 95
95 -
 96
96 -
 97
97 -
 98
98 -
 99
99 -
 100
100
 |
 |

Financial Summary
Pfizer Inc and Subsidiary Companies
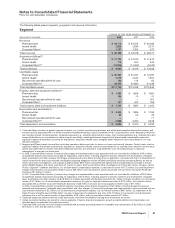
(a) Research and development expenses includes co-promotion charges and milestone payments for intellectual property rights of $377 million in 2008,
$603 million in 2007: $292 million in 2006; $156 million in 2005; $160 million in 2004; and $380 million in 2003.
(b) In 2008, 2007, 2006, 2005, 2004 and 2003, we recorded charges for the estimated portion of the purchase price of acquisitions allocated to in-process
research and development.
(c) Restructuring charges and acquisition-related costs primarily includes the following:
2008—Restructuring charges of $2.6 billion related to our cost-reduction initiatives.
2007—Restructuring charges of $2.5 billion related to our cost-reduction initiatives.
2006—Restructuring charges of $1.3 billion related to our cost-reduction initiatives.
2005—Integration costs of $532 million and restructuring charges of $372 million related to our acquisition of Pharmacia in 2003 and restructuring
charges of $438 million related to our cost-reduction initiatives.
2004—Integration costs of $454 million and restructuring charges of $680 million related to our acquisition of Pharmacia in 2003.
2003—Integration costs of $808 million and restructuring charges of $166 million related to our acquisition of Pharmacia in 2003.
(d) In 2005, as a result of adopting FIN 47, Accounting for Conditional Asset Retirement Obligations, we recorded a non-cash pre-tax charge of $40 million
($23 million, net of tax). In 2003, as a result of adopting SFAS No. 143, Accounting for Asset Retirement Obligations, we recorded a non-cash pre-tax
charge of $47 million ($30 million, net of tax).
(e) Includes discontinued operations, (see Notes to Consolidated Financial Statements—Note 20. Segment, Geographic and Revenue Information.)
(f) For 2005 through 2003, includes assets held for sale of our Consumer Healthcare business, and for 2004 through 2003, also includes in-vitro allergy
and autoimmune diagnostic testing, surgical ophthalmic, certain European generics, confectionery and shaving businesses and the femhrt, Loestrin and
Estrostep women’s health product lines.
(g) Defined as long-term debt, deferred taxes, minority interests and shareholders’ equity.
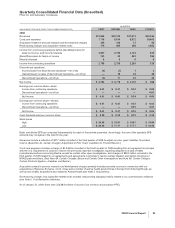
Peer Group Performance Graph
Five Year Performance
0.0
50.0
100.0
150.0
200.0
2003 2004 2005 2006 2007 2008
PFIZER OLD PEER GROUP NEW PEER GROUP S&P 500
2003 2004 2005 2006 2007 2008
Pfizer 100.0 77.7 69.4 80.0 73.5 61.1
Old Peer Group 100.0 101.8 101.2 119.0 132.7 110.1
New Peer Group 100.0 100.6 100.6 118.6 120.5 101.3
S&P 500 100.0 110.9 110.9 134.7 142.1 89.5
Since 2005, Pfizer’s pharmaceutical peer group has consisted of the following companies: Abbott Laboratories, Amgen, AstraZeneca,
Bristol-Myers Squibb Company, Eli Lilly and Company, GlaxoSmithKline, Johnson & Johnson, Merck and Co., Schering-Plough
Corporation and Wyeth (New Peer Group). Prior to that, Pfizer’s pharmaceutical peer group was comprised of Abbot Laboratories,
Baxter International, Bristol-Myers Squibb Company, Colgate-Palmolive Company, Eli Lilly and Company, Johnson & Johnson, Merck
and Co., Schering-Plough Corporation and Wyeth (Old Peer Group).
We believe that the companies included in the New Peer Group are more reflective of the Company’s core business, and therefore will
provide a more meaningful comparison of stock performance. We have included the New Peer Group in the graph to show what the
comparison to those companies would have been if the New Peer Group had been in place during the periods shown on the graph.
96 2008 Financial Report