Pfizer 2008 Annual Report Download - page 94
Download and view the complete annual report
Please find page 94 of the 2008 Pfizer annual report below. You can navigate through the pages in the report by either clicking on the pages listed below, or by using the keyword search tool below to find specific information within the annual report.-
 1
1 -
2
-
3
-
4
-
5
-
6
-
7
-
8
-
9
-
10
-
11
-
12
-
13
-
14
-
15
-
16
-
17
-
18
-
19
-
20
-
21
-
22
-
23
-
24
-
25
-
26
-
27
-
28
-
29
-
30
-
31
-
32
-
33
-
34
-
35
-
36
-
37
-
38
-
39
-
40
-
41
-
42
-
43
-
44
-
45
-
46
-
47
-
48
-
49
-
50
-
51
-
52
-
53
-
54
-
55
-
56
-
57
-
58
-
59
-
60
-
61
-
62
-
63
-
64
-
65
-
66
-
67
-
68
-
69
-
70
-
71
-
72
-
73
-
74
-
75
-
76
-
77
-
78
-
79
-
80
-
81
-
82
-
83
-
 84
84 -
 85
85 -
 86
86 -
 87
87 -
 88
88 -
 89
89 -
 90
90 -
 91
91 -
 92
92 -
 93
93 -
 94
94 -
 95
95 -
 96
96 -
 97
97 -
 98
98 -
 99
99 -
 100
100
 |
 |

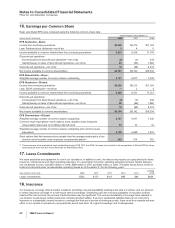
Notes to Consolidated Financial Statements
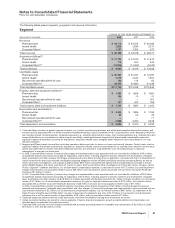
Pfizer Inc and Subsidiary Companies
Geographic
FOR/AS OF THE YEAR ENDED DECEMBER 31,
(MILLIONS OF DOLLARS) 2008 2007 2006
Revenues
United States(a) $20,435 $23,153 $25,822
Europe(b) 14,980 13,647 12,213
Japan/Asia(c) 7,166 6,511 5,939
Canada/Latin America/AFME(d) 5,715 5,107 4,397
Consolidated $48,296 $48,418 $48,371
Long-lived assets(e)
United States(a) $17,296 $19,145 $21,795
Europe(b) 12,220 15,416 17,488
Japan/Asia(c) 1,080 1,177 1,205
Canada/Latin America/AFME(d) 412 494 494
Consolidated $31,008 $36,232 $40,982
(a) Includes operations in Puerto Rico.
(b) Includes France, Italy, Spain, Germany, the U.K., Ireland, Northern Europe and Central-South Europe.
(c) Includes Japan, Australia, Korea, China, Taiwan, Thailand, Singapore and India.
(d) Includes Canada, South America, Central America, Mexico, Africa and the Middle East.
(e) Long-lived assets include identifiable intangible assets (excluding goodwill) and property, plant and equipment.
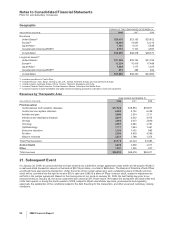
Revenues by Therapeutic Area
YEAR ENDED DECEMBER 31,
(MILLIONS OF DOLLARS) 2008 2007 2006
Pharmaceutical
Cardiovascular and metabolic diseases $17,922 $18,853 $19,871
Central nervous system disorders 6,005 5,152 6,038
Arthritis and pain 3,096 2,914 2,711
Infectious and respiratory diseases 3,931 3,552 3,474
Urology 3,204 3,010 2,809
Oncology 2,551 2,640 2,191
Ophthalmology 1,777 1,643 1,461
Endocrine disorders 1,153 1,052 985
All other 2,284 3,819 4,169
Alliance revenues 2,251 1,789 1,374
Total Pharmaceutical 44,174 44,424 45,083
Animal Health 2,825 2,639 2,311
Other 1,297 1,355 977
Total revenues $48,296 $48,418 $48,371
21. Subsequent Event
On January 26, 2009, we announced that we have entered into a definitive merger agreement under which we will acquire Wyeth in
a cash-and-stock transaction valued on that date at $50.19 per share, or a total of $68 billion. The Boards of Directors of both Pfizer
and Wyeth have approved the transaction. Under the terms of the merger agreement, each outstanding share of Wyeth common
stock will be converted into the right to receive $33 in cash and 0.985 of a share of Pfizer common stock, subject to adjustment as
set forth in the merger agreement. Based on the closing price of our stock on January 23, 2009, the last trading day prior to our
announcement on January 26, the stock component was valued at $17.19 per share. We expect the transaction will close at the end
of the third quarter or during the fourth quarter of 2009, subject to Wyeth shareholder approval, governmental and regulatory
approvals, the satisfaction of the conditions related to the debt financing for the transaction, and other usual and customary closing
conditions.
92 2008 Financial Report