Pfizer 2008 Annual Report Download - page 96
Download and view the complete annual report
Please find page 96 of the 2008 Pfizer annual report below. You can navigate through the pages in the report by either clicking on the pages listed below, or by using the keyword search tool below to find specific information within the annual report.-
 1
1 -
2
-
3
-
4
-
5
-
6
-
7
-
8
-
9
-
10
-
11
-
12
-
13
-
14
-
15
-
16
-
17
-
18
-
19
-
20
-
21
-
22
-
23
-
24
-
25
-
26
-
27
-
28
-
29
-
30
-
31
-
32
-
33
-
34
-
35
-
36
-
37
-
38
-
39
-
40
-
41
-
42
-
43
-
44
-
45
-
46
-
47
-
48
-
49
-
50
-
51
-
52
-
53
-
54
-
55
-
56
-
57
-
58
-
59
-
60
-
61
-
62
-
63
-
64
-
65
-
66
-
67
-
68
-
69
-
70
-
71
-
72
-
73
-
74
-
75
-
76
-
77
-
78
-
79
-
80
-
81
-
82
-
83
-
84
-
85
-
 86
86 -
 87
87 -
 88
88 -
 89
89 -
 90
90 -
 91
91 -
 92
92 -
 93
93 -
 94
94 -
 95
95 -
 96
96 -
 97
97 -
 98
98 -
 99
99 -
 100
100
 |
 |

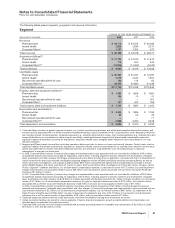
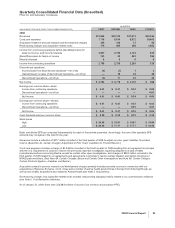
Quarterly Consolidated Financial Data (Unaudited)
Pfizer Inc and Subsidiary Companies
QUARTER
(MILLIONS OF DOLLARS, EXCEPT PER COMMON SHARE DATA) FIRST SECOND THIRD FOURTH
2007
Revenues $12,474 $11,084 $11,990 $12,870
Costs and expenses 7,326 8,414 10,899 9,684
Acquisition-related in-process research and development charges 283 — — —
Restructuring charges and acquisition-related costs 812 1,051 455 216
Income from continuing operations before (benefit)/provision for
taxes on income, and minority interests 4,053 1,619 636 2,970
(Benefit)/provision for taxes on income 689 272 (161) 223
Minority interests 3 2 1 36
Income from continuing operations 3,361 1,345 796 2,711
Discontinued operations:
Income/(loss) from discontinued operations—net of tax — — — (3)
Gains/(losses) on sales of discontinued operations—net of tax 31 (78) (35) 16
Discontinued operations—net of tax 31 (78) (35) 13
Net income $ 3,392 $ 1,267 $ 761 $ 2,724
Earnings per common share—basic:
Income from continuing operations $ 0.48 $ 0.19 $ 0.12 $ 0.40
Discontinued operations—net of tax — (0.01) (0.01) —
Net income $ 0.48 $ 0.18 $ 0.11 $ 0.40
Earnings per common share—diluted:
Income from continuing operations $ 0.48 $ 0.19 $ 0.12 $ 0.40
Discontinued operations—net of tax — (0.01) (0.01) —
Net income $ 0.48 $ 0.18 $ 0.11 $ 0.40
Cash dividends paid per common share $ 0.29 $ 0.29 $ 0.29 $ 0.29
Stock prices
High $ 27.41 $ 27.73 $ 26.15 $ 25.71
Low $ 24.55 $ 25.23 $ 23.13 $ 22.24
Basic and diluted EPS are computed independently for each of the periods presented. Accordingly, the sum of the quarterly EPS
amounts may not agree to the total for the year.
Costs and expenses includes a charge of $2.8 billion recorded in the third quarter of 2007 resulting from our decision to exit Exubera
(See Note 4D. Certain Charges: Exubera).
Acquisition-related in-process research and development charges primarily includes amounts incurred in connection with our
acquisitions of BioRexis Pharmaceutical Corp. and Embrex Inc. (see Note 2. Acquisitions).
Restructuring charges and acquisition-related costs includes restructuring charges primarily related to our cost-reduction initiatives
(see Note 5. Cost-Reduction Initiatives).
94 2008 Financial Report