Pfizer 2008 Annual Report Download - page 20
Download and view the complete annual report
Please find page 20 of the 2008 Pfizer annual report below. You can navigate through the pages in the report by either clicking on the pages listed below, or by using the keyword search tool below to find specific information within the annual report.-
 1
1 -
2
-
3
-
4
-
5
-
6
-
7
-
8
-
9
-
 10
10 -
 11
11 -
 12
12 -
 13
13 -
 14
14 -
 15
15 -
 16
16 -
 17
17 -
 18
18 -
 19
19 -
 20
20 -
 21
21 -
 22
22 -
 23
23 -
 24
24 -
 25
25 -
 26
26 -
 27
27 -
 28
28 -
 29
29 -
 30
30 -
31
-
32
-
33
-
34
-
35
-
36
-
37
-
38
-
39
-
40
-
41
-
42
-
43
-
44
-
45
-
46
-
47
-
48
-
49
-
50
-
51
-
52
-
53
-
54
-
55
-
56
-
57
-
58
-
59
-
60
-
61
-
62
-
63
-
64
-
65
-
66
-
67
-
68
-
69
-
70
-
71
-
72
-
73
-
74
-
75
-
76
-
77
-
78
-
79
-
80
-
81
-
82
-
83
-
84
-
85
-
86
-
87
-
88
-
89
-
90
-
91
-
92
-
93
-
94
-
95
-
96
-
97
-
98
-
99
-
100
 |
 |

Financial Review
Pfizer Inc and Subsidiary Companies
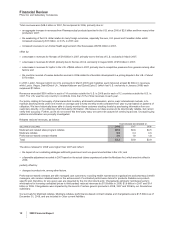
Total revenues were $48.4 billion in 2007, flat compared to 2006, primarily due to:
•an aggregate increase in revenues from Pharmaceutical products launched in the U.S. since 2005 of $2.0 billion and from many in-line
products in 2007;
•the weakening of the U.S. dollar relative to many foreign currencies, especially the euro, U.K. pound and Canadian dollar, which
increased revenues by $1.5 billion, or 3.0%, in 2007; and
•increased revenues in our Animal Health segment and other businesses of $706 million in 2007,
offset by:
•a decrease in revenues for Norvasc of $1.9 billion in 2007, primarily due to the loss of U.S. exclusivity in March 2007;
•a decrease in revenues for Zoloft, primarily due to the loss of U.S. exclusivity in August 2006, of $1.6 billion in 2007;
•a decrease in revenues for Lipitor in the U.S. of $654 million in 2007, primarily due to competitive pressures from generics among other
factors; and
•the one-time reversal of a sales deduction accrual in 2006 related to a favorable development in a pricing dispute in the U.S. of about
$170 million.
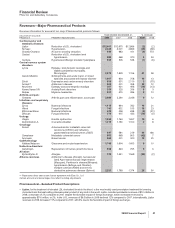
In 2007, Lipitor, Norvasc (which lost U.S. exclusivity in March 2007) and Celebrex each delivered at least $2 billion in revenues,
while Lyrica, Viagra, Detrol/Detrol LA , Xalatan/Xalacom and Zyrtec/Zytec D (which lost U.S. exclusivity in January 2008) each
surpassed $1 billion.
Revenues exceeded $500 million in each of 14 countries outside the U.S. in 2008 and in each of 12 countries outside the U.S. in
2007. The U.S. was the only country to contribute more than 10% of total revenues in each year.
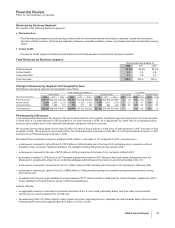
Our policy relating to the supply of pharmaceutical inventory at domestic wholesalers, and in major international markets, is to
maintain stocking levels under one month on average and to keep monthly levels consistent from year to year based on patterns of
utilization. We have historically been able to closely monitor these customer stocking levels by purchasing information from our
customers directly, or by obtaining other third-party information. We believe our data sources to be directionally reliable, but cannot
verify their accuracy. Further, as we do not control this third-party data, we cannot be assured of continuing access. Unusual buying
patterns and utilization are promptly investigated.
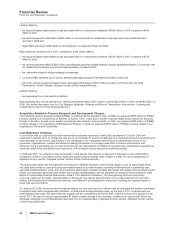
Rebates reduced revenues, as follows:
YEAR ENDED DECEMBER 31,
(BILLIONS OF DOLLARS) 2008 2007 2006
Medicaid and related state program rebates $0.5 $0.6 $0.5
Medicare rebates 0.8 0.4 0.6
Performance-based contract rebates 2.0 1.9 1.8
Total $3.3 $2.9 $2.9
The above rebates for 2008 were higher than 2007 and reflect:
•the impact of our contracting strategies with both government and non-government entities in the U.S.; and
•a favorable adjustment recorded in 2007 based on the actual claims experienced under the Medicare Act, which went into effect in
2006,
partially offset by:
•changes in product mix, among other factors.
Performance-based contracts are with managed care customers, including health maintenance organizations and pharmacy benefit
managers, who receive rebates based on the achievement of contracted performance terms for products. Rebates are product-
specific and, therefore, for any given year are impacted by the mix of products sold. Chargebacks (primarily reimbursements to
wholesalers for honoring contracted prices to third parties) reduced revenues by $1.9 billion in 2008, $1.6 billion in 2007 and $1.4
billion in 2006. Chargebacks were impacted by the launch of certain generic products in 2008, 2007 and 2006 by our Greenstone
subsidiary.
Our accruals for Medicaid rebates, Medicare rebates, performance-based contract rebates and chargebacks were $1.5 billion as of
December 31, 2008, and are included in Other current liabilities.
18 2008 Financial Report