Pfizer 2008 Annual Report Download - page 52
Download and view the complete annual report
Please find page 52 of the 2008 Pfizer annual report below. You can navigate through the pages in the report by either clicking on the pages listed below, or by using the keyword search tool below to find specific information within the annual report.-
 1
1 -
2
-
3
-
4
-
5
-
6
-
7
-
8
-
9
-
10
-
11
-
12
-
13
-
14
-
15
-
16
-
17
-
18
-
19
-
20
-
21
-
22
-
23
-
24
-
25
-
26
-
27
-
28
-
29
-
30
-
31
-
32
-
33
-
34
-
35
-
36
-
37
-
38
-
39
-
40
-
41
-
 42
42 -
 43
43 -
 44
44 -
 45
45 -
 46
46 -
 47
47 -
 48
48 -
 49
49 -
 50
50 -
 51
51 -
 52
52 -
 53
53 -
 54
54 -
 55
55 -
 56
56 -
 57
57 -
 58
58 -
 59
59 -
 60
60 -
 61
61 -
 62
62 -
63
-
64
-
65
-
66
-
67
-
68
-
69
-
70
-
71
-
72
-
73
-
74
-
75
-
76
-
77
-
78
-
79
-
80
-
81
-
82
-
83
-
84
-
85
-
86
-
87
-
88
-
89
-
90
-
91
-
92
-
93
-
94
-
95
-
96
-
97
-
98
-
99
-
100
 |
 |

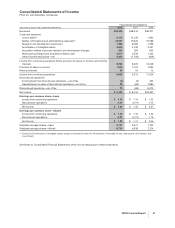
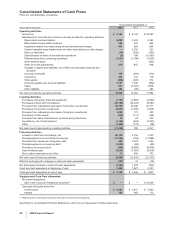
Consolidated Statements of Cash Flows
Pfizer Inc and Subsidiary Companies
YEAR ENDED DECEMBER 31,
(MILLIONS OF DOLLARS) 2008 2007 2006
Operating Activities
Net income $ 8,104 $ 8,144 $ 19,337
Adjustments to reconcile net income to net cash provided by operating activities:
Depreciation and amortization 5,090 5,200 5,293
Share-based compensation expense 384 437 655
Acquisition-related in-process research and development charges 633 283 835
Certain intangible asset impairments and other associated non-cash charges —2,220 320
Gains on disposals (14) (326) (280)
(Gains)/losses on sales of discontinued operations (6) 168 (10,243)
Deferred taxes from continuing operations (1,331) (2,788) (1,525)
Other deferred taxes —— (420)
Other non-cash adjustments 519 815 606
Changes in assets and liabilities, net of effect of businesses acquired and
divested:
Accounts receivable 195 (320) (172)
Inventories 294 720 118
Other assets (538) (647) 314
Accounts payable and accrued liabilities 3,797 1,509 (450)
Taxes 647 (2,002) 2,909
Other liabilities 464 (60) 297
Net cash provided by operating activities 18,238 13,353 17,594
Investing Activities
Purchases of property, plant and equipment (1,701) (1,880) (2,050)
Purchases of short-term investments (35,705) (25,426) (9,597)
Proceeds from redemptions and sales of short-term investments 35,796 30,288 20,771
Purchases of long-term investments (9,357) (1,635) (1,925)
Proceeds from redemptions and sales of long-term investments 1,009 172 233
Purchases of other assets (210) (111) (153)
Proceeds from sales of businesses, products and product lines 12 24 200
Acquisitions, net of cash acquired (1,184) (464) (2,320)
Other (1,495) (173) (58)
Net cash (used in)/provided by investing activities (12,835) 795 5,101
Financing Activities
Increase in short-term borrowings, net 40,119 3,155 1,040
Principal payments on short-term borrowings (37,264) (764) (11,969)
Proceeds from issuances of long-term debt 605 2,573 1,050
Principal payments on long-term debt (1,053) (64) (55)
Purchases of common stock (500) (9,994) (6,979)
Cash dividends paid (8,541) (7,975) (6,919)
Stock option transactions and other 74 459 732
Net cash used in financing activities (6,560) (12,610) (23,100)
Effect of exchange-rate changes on cash and cash equivalents (127) 41 (15)
Net (decrease)/ increase in cash and cash equivalents (1,284) 1,579 (420)
Cash and cash equivalents at beginning of year 3,406 1,827 2,247
Cash and cash equivalents at end of year $ 2,122 $ 3,406 $ 1,827
Supplemental Cash Flow Information
Non-cash transactions:
Sale of the Consumer Healthcare business(a) $— $ — $ 16,429
Cash paid during the period for:
Income taxes $ 2,252 $ 5,617 $ 3,443
Interest 782 643 715
(a) Reflects portion of proceeds received in the form of short-term investments.
See Notes to Consolidated Financial Statements, which are an integral part of these statements.
50 2008 Financial Report