Pfizer 2008 Annual Report Download - page 38
Download and view the complete annual report
Please find page 38 of the 2008 Pfizer annual report below. You can navigate through the pages in the report by either clicking on the pages listed below, or by using the keyword search tool below to find specific information within the annual report.-
 1
1 -
2
-
3
-
4
-
5
-
6
-
7
-
8
-
9
-
10
-
11
-
12
-
13
-
14
-
15
-
16
-
17
-
18
-
19
-
20
-
21
-
22
-
23
-
24
-
25
-
26
-
27
-
 28
28 -
 29
29 -
 30
30 -
 31
31 -
 32
32 -
 33
33 -
 34
34 -
 35
35 -
 36
36 -
 37
37 -
 38
38 -
 39
39 -
 40
40 -
 41
41 -
 42
42 -
 43
43 -
 44
44 -
 45
45 -
 46
46 -
 47
47 -
 48
48 -
49
-
50
-
51
-
52
-
53
-
54
-
55
-
56
-
57
-
58
-
59
-
60
-
61
-
62
-
63
-
64
-
65
-
66
-
67
-
68
-
69
-
70
-
71
-
72
-
73
-
74
-
75
-
76
-
77
-
78
-
79
-
80
-
81
-
82
-
83
-
84
-
85
-
86
-
87
-
88
-
89
-
90
-
91
-
92
-
93
-
94
-
95
-
96
-
97
-
98
-
99
-
100
 |
 |

Financial Review
Pfizer Inc and Subsidiary Companies
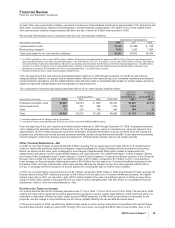
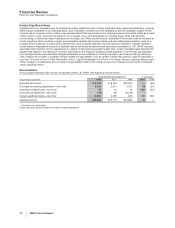
Selected Measures of Liquidity and Capital Resources
The following table sets forth certain relevant measures of our liquidity and capital resources as of December 31:
AS OF DECEMBER 31,
(MILLIONS OF DOLLARS, EXCEPT RATIOS AND PER COMMON SHARE DATA) 2008 2007
Cash and cash equivalents and short-term investments and loans $24,555 $26,092
Working capital(a) $16,067 $25,014
Ratio of current assets to current liabilities 1.59:1 2.15:1
Shareholders’ equity per common share(b) $ 8.56 $ 9.65
(a) Working capital includes assets held for sale of $148 million as of December 31, 2008, and $114 million as of December 31, 2007.
(b) Represents total shareholders’ equity divided by the actual number of common shares outstanding (which excludes treasury shares and those held
by our employee benefit trust).
Working capital and the ratio of current assets to current liabilities in 2008 were lower than in 2007, primarily due to:
•an increase in liabilities of $3.2 billion, related to legal matters concerning Celebrex and Bextra. (See the “Our 2008 Performance:
Certain Charges—Bextra and Certain Other Investigations and Certain Charges—Certain Product Litigation—Celebrex and Bextra”
sections of this Financial Review.)
•the unfavorable impact of foreign exchange of about $1 billion;
•an increase in cash generated from operations being invested in long-term investments; and
•the timing of accruals, cash receipts and payments in the ordinary course of business.
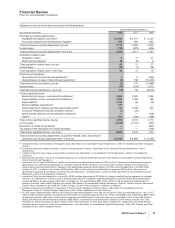
Summary of Cash Flows
YEAR ENDED DECEMBER 31,
(MILLIONS OF DOLLARS) 2008 2007 2006
Cash provided by/(used in):
Operating activities $ 18,238 $ 13,353 $ 17,594
Investing activities (12,835) 795 5,101
Financing activities (6,560) (12,610) (23,100)
Effect of exchange-rate changes on cash and cash equivalents (127) 41 (15)
Net increase/(decrease) in cash and cash equivalents $ (1,284) $ 1,579 $ (420)
Operating Activities
Our net cash provided by continuing operating activities was $18.2 billion in 2008, compared to $13.4 billion in 2007. The increase in
net cash provided by operating activities was primarily attributable to:
•lower tax payments ($3.4 billion) made in 2008, primarily due to the higher taxes paid in 2007, substantially all of which related to the
gain on the sale of our Consumer Healthcare business in December 2006;
•the sale of certain royalty rights ($425 million); and
•the timing of other receipts and payments in the ordinary course of business.
Our net cash provided by continuing operating activities was $13.4 billion in 2007, compared to $17.6 billion in 2006. The decrease
in net cash provided by operating activities was primarily attributable to:
•higher tax payments ($2.2 billion) in 2007, related primarily to the gain on the sale of our Consumer Healthcare business in December
2006; and
•the timing of other receipts and payments in the ordinary course of business.
In 2008, the cash flow line item called Accounts payable and accrued liabilities primarily reflects the $3.2 billion accrued in 2008 for
legal matters related to Celebrex and Bextra that has not yet been paid. In 2007 and 2006, the cash flow line item called Taxes
primarily reflects the taxes provided in 2006 on the gain on the sale of our Consumer Healthcare business that were paid in 2007.
36 2008 Financial Report