PG&E 2012 Annual Report Download - page 98
Download and view the complete annual report
Please find page 98 of the 2012 PG&E annual report below. You can navigate through the pages in the report by either clicking on the pages listed below, or by using the keyword search tool below to find specific information within the annual report.-
 1
1 -
2
-
3
-
4
-
5
-
6
-
7
-
8
-
9
-
10
-
11
-
12
-
13
-
14
-
15
-
16
-
17
-
18
-
19
-
20
-
21
-
22
-
23
-
24
-
25
-
26
-
27
-
28
-
29
-
30
-
31
-
32
-
33
-
34
-
35
-
36
-
37
-
38
-
39
-
40
-
41
-
42
-
43
-
44
-
45
-
46
-
47
-
48
-
49
-
50
-
51
-
52
-
53
-
54
-
55
-
56
-
57
-
58
-
59
-
60
-
61
-
62
-
63
-
64
-
65
-
66
-
67
-
68
-
69
-
70
-
71
-
72
-
73
-
74
-
75
-
76
-
77
-
78
-
79
-
80
-
81
-
82
-
83
-
84
-
85
-
86
-
87
-
 88
88 -
 89
89 -
 90
90 -
 91
91 -
 92
92 -
 93
93 -
 94
94 -
 95
95 -
 96
96 -
 97
97 -
 98
98 -
 99
99 -
 100
100 -
 101
101 -
 102
102 -
 103
103 -
 104
104 -
 105
105 -
 106
106 -
 107
107 -
 108
108 -
109
-
110
-
111
-
112
-
113
-
114
-
115
-
116
-
117
-
118
-
119
-
120
-
121
-
122
-
123
-
124
-
125
-
126
-
127
-
128
-
129
-
130
-
131
-
132
-
133
-
134
-
135
-
136
 |
 |

NOTES TO THE CONSOLIDATED FINANCIAL STATEMENTS (Continued)
NOTE 11: FAIR VALUE MEASUREMENTS (Continued)
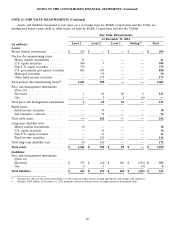
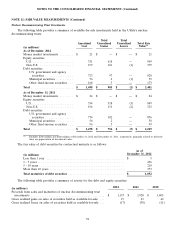
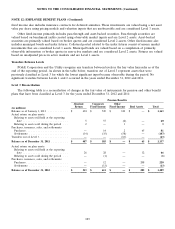
Nuclear Decommissioning Trust Investments
The following table provides a summary of available-for-sale investments held in the Utility’s nuclear
decommissioning trusts:
Total Total
Amortized Unrealized Unrealized Total Fair
Cost Gains Losses Value(1)
(in millions)
As of December, 2012
Money market investments ........ $ 21 $ —$ —$21
Equity securities
U.S. ....................... 331 618 — 949
Non-U.S. ................... 199 181 (1) 379
Debt securities
U.S. government and agency
securities ................ 723 97 — 820
Municipal securities .......... 56 4 (1) 59
Other fixed-income securities . . . 168 5 — 173
Total ........................ $ 1,498 $ 905 $ (2) $ 2,401
As of December 31, 2011
Money market investments ........ $ 24 $ —$ —$24
Equity securities
U.S. ....................... 334 518 (3) 849
Non-U.S. ................... 194 131 (2) 323
Debt securities
U.S. government and agency
securities ................ 774 102 — 876
Municipal securities .......... 56 2 — 58
Other fixed-income securities . . . 96 3 — 99
Total ........................ $ 1,478 $ 756 $ (5) $ 2,229
(1) Excludes $240 million and $188 million at December 31, 2012 and December 31, 2011, respectively, primarily related to deferred
taxes on appreciation of investment value.
The fair value of debt securities by contractual maturity is as follows:
As of
December 31, 2012
(in millions)
Less than 1 year ............................................ $ 5
1 - 5 years ................................................. 456
5 - 10 years ................................................ 218
More than 10 years .......................................... 373
Total maturities of debt securities ................................ $ 1,052
The following table provides a summary of activity for the debt and equity securities:
2012 2011 2010
(in millions)
Proceeds from sales and maturities of nuclear decommissioning trust
investments .......................................... $ 1,133 $ 1,928 $ 1,405
Gross realized gains on sales of securities held as available-for-sale . . . 19 43 42
Gross realized losses on sales of securities held as available-for-sale . . . (17) (30) (11)
94