PG&E 2012 Annual Report Download - page 124
Download and view the complete annual report
Please find page 124 of the 2012 PG&E annual report below. You can navigate through the pages in the report by either clicking on the pages listed below, or by using the keyword search tool below to find specific information within the annual report.-
 1
1 -
2
-
3
-
4
-
5
-
6
-
7
-
8
-
9
-
10
-
11
-
12
-
13
-
14
-
15
-
16
-
17
-
18
-
19
-
20
-
21
-
22
-
23
-
24
-
25
-
26
-
27
-
28
-
29
-
30
-
31
-
32
-
33
-
34
-
35
-
36
-
37
-
38
-
39
-
40
-
41
-
42
-
43
-
44
-
45
-
46
-
47
-
48
-
49
-
50
-
51
-
52
-
53
-
54
-
55
-
56
-
57
-
58
-
59
-
60
-
61
-
62
-
63
-
64
-
65
-
66
-
67
-
68
-
69
-
70
-
71
-
72
-
73
-
74
-
75
-
76
-
77
-
78
-
79
-
80
-
81
-
82
-
83
-
84
-
85
-
86
-
87
-
88
-
89
-
90
-
91
-
92
-
93
-
94
-
95
-
96
-
97
-
98
-
99
-
100
-
101
-
102
-
103
-
104
-
105
-
106
-
107
-
108
-
109
-
110
-
111
-
112
-
113
-
 114
114 -
 115
115 -
 116
116 -
 117
117 -
 118
118 -
 119
119 -
 120
120 -
 121
121 -
 122
122 -
 123
123 -
 124
124 -
 125
125 -
 126
126 -
 127
127 -
 128
128 -
 129
129 -
 130
130 -
 131
131 -
 132
132 -
 133
133 -
 134
134 -
135
-
136
 |
 |

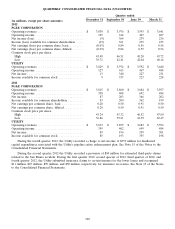
QUARTERLY CONSOLIDATED FINANCIAL DATA (UNAUDITED)
Quarter ended
December 31 September 30 June 30 March 31
(in millions, except per share amounts)
2012
PG&E CORPORATION
Operating revenues .......................... $ 3,830 $ 3,976 $ 3,593 $ 3,641
Operating income ........................... 125 614 467 487
Net income (loss) ........................... (9) 364 239 236
Income (loss) available for common shareholders .... (13) 361 235 233
Net earnings (loss) per common share, basic ........ (0.03) 0.84 0.56 0.56
Net earnings (loss) per common share, diluted ...... (0.03) 0.84 0.55 0.56
Common stock price per share:
High................................... 43.48 46.51 45.20 43.72
Low ................................... 39.71 42.41 42.04 40.16
UTILITY
Operating revenues .......................... $ 3,829 $ 3,974 $ 3,592 $ 3,640
Operating income ........................... 127 613 467 488
Net income ................................ 13 340 227 231
Income available for common stock .............. 9 337 223 228
2011
PG&E CORPORATION
Operating revenues .......................... $ 3,815 $ 3,860 $ 3,684 $ 3,597
Operating income ........................... 358 408 692 484
Net income ................................ 87 203 366 202
Income available for common shareholders ......... 83 200 362 199
Net earnings per common share, basic ............ 0.20 0.50 0.91 0.50
Net earnings per common share, diluted ........... 0.20 0.50 0.91 0.50
Common stock price per share:
High................................... 43.24 43.32 46.52 47.60
Low ................................... 36.86 39.21 41.39 42.47
UTILITY
Operating revenues .......................... $ 3,813 $ 3,859 $ 3,683 $ 3,596
Operating income ........................... 359 402 699 484
Net income ................................ 89 196 359 201
Income available for common stock .............. 85 193 355 198
During the fourth quarter 2012, the Utility recorded a charge to net income of $353 million for disallowed
capital expenditures associated with the Utility’s pipeline safety enhancement plan. See Note 15 of the Notes to the
Consolidated Financial Statements.
During the second quarter 2012 the Utility recorded a provision of $80 million for estimated third-party claims
related to the San Bruno accident. During the first quarter 2012, second quarter of 2012, third quarter of 2012, and
fourth quarter 2012, the Utility submitted insurance claims to certain insurers for the lower layers and recognized
$11 million, $25 million, $99 million, and $50 million, respectively, for insurance recoveries. See Note 15 of the Notes
to the Consolidated Financial Statements.
120