PG&E 2012 Annual Report Download - page 91
Download and view the complete annual report
Please find page 91 of the 2012 PG&E annual report below. You can navigate through the pages in the report by either clicking on the pages listed below, or by using the keyword search tool below to find specific information within the annual report.-
 1
1 -
2
-
3
-
4
-
5
-
6
-
7
-
8
-
9
-
10
-
11
-
12
-
13
-
14
-
15
-
16
-
17
-
18
-
19
-
20
-
21
-
22
-
23
-
24
-
25
-
26
-
27
-
28
-
29
-
30
-
31
-
32
-
33
-
34
-
35
-
36
-
37
-
38
-
39
-
40
-
41
-
42
-
43
-
44
-
45
-
46
-
47
-
48
-
49
-
50
-
51
-
52
-
53
-
54
-
55
-
56
-
57
-
58
-
59
-
60
-
61
-
62
-
63
-
64
-
65
-
66
-
67
-
68
-
69
-
70
-
71
-
72
-
73
-
74
-
75
-
76
-
77
-
78
-
79
-
80
-
 81
81 -
 82
82 -
 83
83 -
 84
84 -
 85
85 -
 86
86 -
 87
87 -
 88
88 -
 89
89 -
 90
90 -
 91
91 -
 92
92 -
 93
93 -
 94
94 -
 95
95 -
 96
96 -
 97
97 -
 98
98 -
 99
99 -
 100
100 -
 101
101 -
102
-
103
-
104
-
105
-
106
-
107
-
108
-
109
-
110
-
111
-
112
-
113
-
114
-
115
-
116
-
117
-
118
-
119
-
120
-
121
-
122
-
123
-
124
-
125
-
126
-
127
-
128
-
129
-
130
-
131
-
132
-
133
-
134
-
135
-
136
 |
 |

NOTES TO THE CONSOLIDATED FINANCIAL STATEMENTS (Continued)
NOTE 10: DERIVATIVES (Continued)
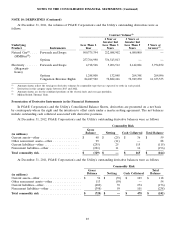
At December 31, 2011, the volumes of PG&E Corporation’s and the Utility’s outstanding derivatives were as
follows:
Contract Volume(1)
1 Year or 3 Years or
Greater but Greater but
Underlying Less Than 1 Less Than 3 Less Than 5 5 Years or
Product Instruments Year Years Years Greater(2)
Natural Gas(3) .... Forwards and Swaps 500,375,394 212,088,902 6,080,000 —
(MMBtus(4))
Options 257,766,990 336,543,013 ——
Electricity ....... Forwards and Swaps 4,718,568 5,206,512 2,142,024 3,754,872
(Megawatt-
hours)
Options 1,248,000 132,048 264,348 264,096
Congestion Revenue Rights 84,247,502 72,882,246 72,949,250 61,673,535
(1) Amounts shown reflect the total gross derivative volumes by commodity type that are expected to settle in each period.
(2) Derivatives in this category expire between 2017 and 2022.
(3) Amounts shown are for the combined positions of the electric fuels and core gas portfolios.
(4) Million British Thermal Units.
Presentation of Derivative Instruments in the Financial Statements
In PG&E Corporation’s and the Utility’s Consolidated Balance Sheets, derivatives are presented on a net basis
by counterparty where the right and the intention to offset exists under a master netting agreement. The net balances
include outstanding cash collateral associated with derivative positions.
At December 31, 2012, PG&E Corporation’s and the Utility’s outstanding derivative balances were as follows:
Commodity Risk
Gross
Balance Netting Cash Collateral Total Balance
(in millions)
Current assets—other ...................... $ 48 $ (25) $ 36 $ 59
Other noncurrent assets—other ............... 99 (11) — 88
Current liabilities—other .................... (255) 25 115 (115)
Noncurrent liabilities—other ................. (221) 11 14 (196)
Total commodity risk ....................... $ (329) $ — $ 165 $ (164)
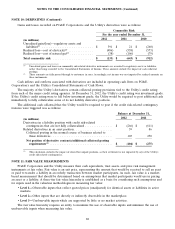
At December 31, 2011, PG&E Corporation’s and the Utility’s outstanding derivative balances were as follows:
Commodity Risk
Gross Total
Balance Netting Cash Collateral Balance
(in millions)
Current assets—other ....................... $ 54 $ (39) $ 103 $ 118
Other noncurrent assets—other ................ 113 (59) — 54
Current liabilities—other ..................... (489) 39 274 (176)
Noncurrent liabilities—other .................. (398) 59 101 (238)
Total commodity risk ....................... $ (720) $ — $ 478 $ (242)
87