PG&E 2012 Annual Report Download - page 59
Download and view the complete annual report
Please find page 59 of the 2012 PG&E annual report below. You can navigate through the pages in the report by either clicking on the pages listed below, or by using the keyword search tool below to find specific information within the annual report.-
 1
1 -
2
-
3
-
4
-
5
-
6
-
7
-
8
-
9
-
10
-
11
-
12
-
13
-
14
-
15
-
16
-
17
-
18
-
19
-
20
-
21
-
22
-
23
-
24
-
25
-
26
-
27
-
28
-
29
-
30
-
31
-
32
-
33
-
34
-
35
-
36
-
37
-
38
-
39
-
40
-
41
-
42
-
43
-
44
-
45
-
46
-
47
-
48
-
 49
49 -
 50
50 -
 51
51 -
 52
52 -
 53
53 -
 54
54 -
 55
55 -
 56
56 -
 57
57 -
 58
58 -
 59
59 -
 60
60 -
 61
61 -
 62
62 -
 63
63 -
 64
64 -
 65
65 -
 66
66 -
 67
67 -
 68
68 -
 69
69 -
70
-
71
-
72
-
73
-
74
-
75
-
76
-
77
-
78
-
79
-
80
-
81
-
82
-
83
-
84
-
85
-
86
-
87
-
88
-
89
-
90
-
91
-
92
-
93
-
94
-
95
-
96
-
97
-
98
-
99
-
100
-
101
-
102
-
103
-
104
-
105
-
106
-
107
-
108
-
109
-
110
-
111
-
112
-
113
-
114
-
115
-
116
-
117
-
118
-
119
-
120
-
121
-
122
-
123
-
124
-
125
-
126
-
127
-
128
-
129
-
130
-
131
-
132
-
133
-
134
-
135
-
136
 |
 |

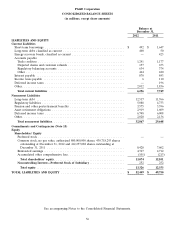
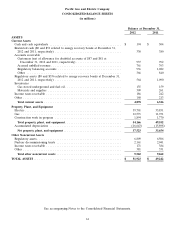
PG&E Corporation
CONSOLIDATED BALANCE SHEETS
(in millions)
Balance at
December 31,
2012 2011
ASSETS
Current Assets
Cash and cash equivalents ........................................... $ 401 $ 513
Restricted cash ($0 and $51 related to energy recovery bonds at December 31, 2012
and 2011, respectively) ............................................ 330 380
Accounts receivable
Customers (net of allowance for doubtful accounts of $87 and $81 at
December 31, 2012 and 2011, respectively) ........................... 937 992
Accrued unbilled revenue ......................................... 761 763
Regulatory balancing accounts ...................................... 936 1,082
Other ........................................................ 365 839
Regulatory assets ($0 and $336 related to energy recovery bonds at December 31,
2012 and 2011, respectively) ........................................ 564 1,090
Inventories
Gas stored underground and fuel oil ................................. 135 159
Materials and supplies ............................................ 309 261
Income taxes receivable ............................................ 211 183
Other .......................................................... 172 218
Total current assets .............................................. 5,121 6,480
Property, Plant, and Equipment
Electric ........................................................ 39,701 35,851
Gas........................................................... 12,571 11,931
Construction work in progress ........................................ 1,894 1,770
Other .......................................................... 1 15
Total property, plant, and equipment ................................. 54,167 49,567
Accumulated depreciation ........................................... (16,644) (15,912)
Net property, plant, and equipment .................................. 37,523 33,655
Other Noncurrent Assets
Regulatory assets ................................................. 6,809 6,506
Nuclear decommissioning trusts ....................................... 2,161 2,041
Income taxes receivable ............................................ 176 386
Other .......................................................... 659 682
Total other noncurrent assets ....................................... 9,805 9,615
TOTAL ASSETS ................................................... $ 52,449 $ 49,750
See accompanying Notes to the Consolidated Financial Statements.
55