PG&E 2012 Annual Report Download - page 83
Download and view the complete annual report
Please find page 83 of the 2012 PG&E annual report below. You can navigate through the pages in the report by either clicking on the pages listed below, or by using the keyword search tool below to find specific information within the annual report.-
 1
1 -
2
-
3
-
4
-
5
-
6
-
7
-
8
-
9
-
10
-
11
-
12
-
13
-
14
-
15
-
16
-
17
-
18
-
19
-
20
-
21
-
22
-
23
-
24
-
25
-
26
-
27
-
28
-
29
-
30
-
31
-
32
-
33
-
34
-
35
-
36
-
37
-
38
-
39
-
40
-
41
-
42
-
43
-
44
-
45
-
46
-
47
-
48
-
49
-
50
-
51
-
52
-
53
-
54
-
55
-
56
-
57
-
58
-
59
-
60
-
61
-
62
-
63
-
64
-
65
-
66
-
67
-
68
-
69
-
70
-
71
-
72
-
 73
73 -
 74
74 -
 75
75 -
 76
76 -
 77
77 -
 78
78 -
 79
79 -
 80
80 -
 81
81 -
 82
82 -
 83
83 -
 84
84 -
 85
85 -
 86
86 -
 87
87 -
 88
88 -
 89
89 -
 90
90 -
 91
91 -
 92
92 -
 93
93 -
94
-
95
-
96
-
97
-
98
-
99
-
100
-
101
-
102
-
103
-
104
-
105
-
106
-
107
-
108
-
109
-
110
-
111
-
112
-
113
-
114
-
115
-
116
-
117
-
118
-
119
-
120
-
121
-
122
-
123
-
124
-
125
-
126
-
127
-
128
-
129
-
130
-
131
-
132
-
133
-
134
-
135
-
136
 |
 |

NOTES TO THE CONSOLIDATED FINANCIAL STATEMENTS (Continued)
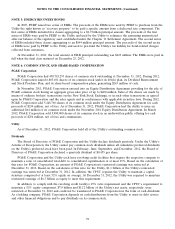
NOTE 6: COMMON STOCK AND SHARE-BASED COMPENSATION (Continued)
Long-Term Incentive Plan
The PG&E Corporation 2006 Long-Term Incentive Plan (‘‘2006 LTIP’’) permits the award of various forms of
incentive awards, including stock options, stock appreciation rights, restricted stock awards, restricted stock units
(‘‘RSUs’’), performance shares, deferred compensation awards, and other share-based awards, to eligible employees
of PG&E Corporation and its subsidiaries. Non-employee directors of PG&E Corporation are also eligible to receive
share-based awards under the formula grant provisions of the 2006 LTIP. A maximum of 12 million shares of PG&E
Corporation common stock (subject to adjustment for changes in capital structure, stock dividends, or other similar
events) has been reserved for issuance under the 2006 LTIP, of which 4,548,119 shares were available for award at
December 31, 2012.
The following table provides a summary of total compensation expense for PG&E Corporation for share-based
incentive awards for 2012, 2011, and 2010:
2012 2011 2010
(in millions)
Restricted stock units ....................... $ 31 $ 22 $ 9
Other share-based compensation ............... —114
Performance shares:
Equity awards ............................. 26 16 11
Liability awards ............................ —(13) 22
Total compensation expense (pre-tax) ............ $57$26$56
Total compensation expense (after-tax) ........... $34$16$33
There were no significant share-based compensation costs capitalized during 2012, 2011, and 2010. There was no
material difference between PG&E Corporation and the Utility for the information disclosed above.
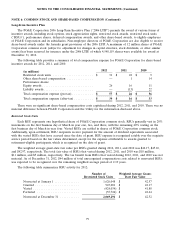
Restricted Stock Units
Each RSU represents one hypothetical share of PG&E Corporation common stock. RSUs generally vest in 20%
increments on the first business day of March in year one, two, and three, with the remaining 40% vesting on the
first business day of March in year four. Vested RSUs are settled in shares of PG&E Corporation common stock.
Additionally, upon settlement, RSU recipients receive payment for the amount of dividend equivalents associated
with the vested RSUs that have accrued since the date of grant. RSU expense is recognized ratably over the requisite
service period based on the fair values determined, except for the expense attributable to awards granted to
retirement-eligible participants, which is recognized on the date of grant.
The weighted average grant-date fair value per RSUs granted during 2012, 2011, and 2010 was $42.17, $45.10,
and $42.97, respectively. The total fair value of RSUs that vested during 2012, 2011, and 2010 was $18 million,
$11 million, and $5 million, respectively. The tax benefit from RSUs that vested during 2012, 2011, and 2010 was not
material. As of December 31, 2012, $44 million of total unrecognized compensation costs related to nonvested RSUs
was expected to be recognized over the remaining weighted average period of 2.19 years.
The following table summarizes RSU activity for 2012:
Number of Weighted Average Grant-
Restricted Stock Units Date Fair Value
Nonvested at January 1 .............. 1,626,048 $ 42.57
Granted ......................... 923,001 $ 42.17
Vested .......................... (424,034) $ 41.88
Forfeited ........................ (55,724) $ 42.64
Nonvested at December 31 ........... 2,069,291 $ 42.52
79