PG&E 2012 Annual Report Download - page 92
Download and view the complete annual report
Please find page 92 of the 2012 PG&E annual report below. You can navigate through the pages in the report by either clicking on the pages listed below, or by using the keyword search tool below to find specific information within the annual report.-
 1
1 -
2
-
3
-
4
-
5
-
6
-
7
-
8
-
9
-
10
-
11
-
12
-
13
-
14
-
15
-
16
-
17
-
18
-
19
-
20
-
21
-
22
-
23
-
24
-
25
-
26
-
27
-
28
-
29
-
30
-
31
-
32
-
33
-
34
-
35
-
36
-
37
-
38
-
39
-
40
-
41
-
42
-
43
-
44
-
45
-
46
-
47
-
48
-
49
-
50
-
51
-
52
-
53
-
54
-
55
-
56
-
57
-
58
-
59
-
60
-
61
-
62
-
63
-
64
-
65
-
66
-
67
-
68
-
69
-
70
-
71
-
72
-
73
-
74
-
75
-
76
-
77
-
78
-
79
-
80
-
81
-
 82
82 -
 83
83 -
 84
84 -
 85
85 -
 86
86 -
 87
87 -
 88
88 -
 89
89 -
 90
90 -
 91
91 -
 92
92 -
 93
93 -
 94
94 -
 95
95 -
 96
96 -
 97
97 -
 98
98 -
 99
99 -
 100
100 -
 101
101 -
 102
102 -
103
-
104
-
105
-
106
-
107
-
108
-
109
-
110
-
111
-
112
-
113
-
114
-
115
-
116
-
117
-
118
-
119
-
120
-
121
-
122
-
123
-
124
-
125
-
126
-
127
-
128
-
129
-
130
-
131
-
132
-
133
-
134
-
135
-
136
 |
 |

NOTES TO THE CONSOLIDATED FINANCIAL STATEMENTS (Continued)
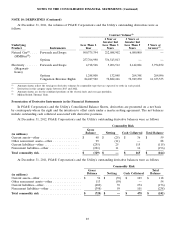
NOTE 10: DERIVATIVES (Continued)
Gains and losses recorded on PG&E Corporation’s and the Utility’s derivatives were as follows:
Commodity Risk
For the year ended December 31,
2012 2011 2010
(in millions)
Unrealized gain/(loss)—regulatory assets and
liabilities(1) ............................. $ 391 $ 21 $ (260)
Realized loss—cost of electricity(2) .............. (486) (558) (573)
Realized loss—cost of natural gas(2) ............. (38) (106) (79)
Total commodity risk ....................... $ (133) $ (643) $ (912)
(1) Unrealized gains and losses on commodity risk-related derivative instruments are recorded to regulatory assets or liabilities,
rather than being recorded to the Consolidated Statements of Income. These amounts exclude the impact of cash collateral
postings.
(2) These amounts are fully passed through to customers in rates. Accordingly, net income was not impacted by realized amounts on
these instruments.
Cash inflows and outflows associated with derivatives are included in operating cash flows on PG&E
Corporation’s and the Utility’s Consolidated Statements of Cash Flows.
The majority of the Utility’s derivatives contain collateral posting provisions tied to the Utility’s credit rating
from each of the major credit rating agencies. At December 31, 2012, the Utility’s credit rating was investment grade.
If the Utility’s credit rating were to fall below investment grade, the Utility would be required to post additional cash
immediately to fully collateralize some of its net liability derivative positions.
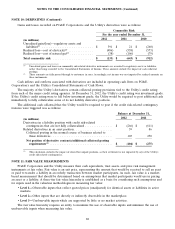
The additional cash collateral that the Utility would be required to post if the credit risk-related contingency
features were triggered was as follows:
Balance at December 31,
2012 2011
(in millions)
Derivatives in a liability position with credit risk-related
contingencies that are not fully collateralized ................ $ (266) $ (611)
Related derivatives in an asset position ...................... 59 86
Collateral posting in the normal course of business related to
these derivatives ................................... 103 250
Net position of derivative contracts/additional collateral posting
requirements(1) .................................... $ (104) $ (275)
(1) This calculation excludes the impact of closed but unpaid positions, as their settlement is not impacted by any of the Utility’s
credit risk-related contingencies.
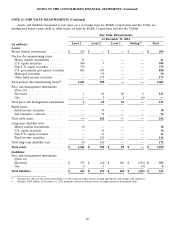
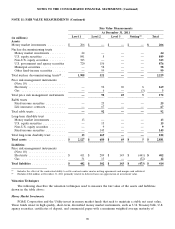
NOTE 11: FAIR VALUE MEASUREMENTS
PG&E Corporation and the Utility measure their cash equivalents, trust assets, and price risk management
instruments at fair value. Fair value is an exit price, representing the amount that would be received to sell an asset
or paid to transfer a liability in an orderly transaction between market participants. As such, fair value is a market-
based measurement that should be determined based on assumptions that market participants would use in pricing
an asset or a liability. A three-tier fair value hierarchy is established as a basis for considering such assumptions and
for inputs used in the valuation methodologies in measuring fair value:
•Level 1—Observable inputs that reflect quoted prices (unadjusted) for identical assets or liabilities in active
markets.
•Level 2—Other inputs that are directly or indirectly observable in the marketplace.
•Level 3—Unobservable inputs which are supported by little or no market activities.
The fair value hierarchy requires an entity to maximize the use of observable inputs and minimize the use of
unobservable inputs when measuring fair value.
88