PG&E 2012 Annual Report Download - page 71
Download and view the complete annual report
Please find page 71 of the 2012 PG&E annual report below. You can navigate through the pages in the report by either clicking on the pages listed below, or by using the keyword search tool below to find specific information within the annual report.-
 1
1 -
2
-
3
-
4
-
5
-
6
-
7
-
8
-
9
-
10
-
11
-
12
-
13
-
14
-
15
-
16
-
17
-
18
-
19
-
20
-
21
-
22
-
23
-
24
-
25
-
26
-
27
-
28
-
29
-
30
-
31
-
32
-
33
-
34
-
35
-
36
-
37
-
38
-
39
-
40
-
41
-
42
-
43
-
44
-
45
-
46
-
47
-
48
-
49
-
50
-
51
-
52
-
53
-
54
-
55
-
56
-
57
-
58
-
59
-
60
-
 61
61 -
 62
62 -
 63
63 -
 64
64 -
 65
65 -
 66
66 -
 67
67 -
 68
68 -
 69
69 -
 70
70 -
 71
71 -
 72
72 -
 73
73 -
 74
74 -
 75
75 -
 76
76 -
 77
77 -
 78
78 -
 79
79 -
 80
80 -
 81
81 -
82
-
83
-
84
-
85
-
86
-
87
-
88
-
89
-
90
-
91
-
92
-
93
-
94
-
95
-
96
-
97
-
98
-
99
-
100
-
101
-
102
-
103
-
104
-
105
-
106
-
107
-
108
-
109
-
110
-
111
-
112
-
113
-
114
-
115
-
116
-
117
-
118
-
119
-
120
-
121
-
122
-
123
-
124
-
125
-
126
-
127
-
128
-
129
-
130
-
131
-
132
-
133
-
134
-
135
-
136
 |
 |
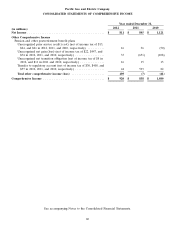
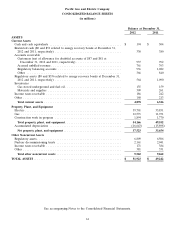
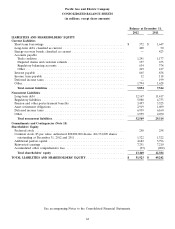
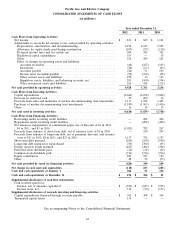
NOTES TO THE CONSOLIDATED FINANCIAL STATEMENTS (Continued)
NOTE 2: SUMMARY OF SIGNIFICANT ACCOUNTING POLICIES (Continued)
the Utility records those expected future costs as regulatory liabilities. In addition, amounts that are probable of
being credited or refunded to customers in the future are recorded as regulatory liabilities.
The Utility’s ability to recover the revenue requirements that have been authorized by the CPUC in a general
rate case (‘‘GRC’’) and a gas transmission and storage rate case (‘‘GT&S’’) does not depend on the volume of the
Utility’s sales of electricity and natural gas services. The Utility’s recovery of a significant portion of its authorized
revenue requirements through rates is independent, or ‘‘decoupled,’’ from the volume of electricity and natural gas
sales.
The Utility records differences between actual customer billings and the Utility’s authorized revenue
requirement, as well as differences between incurred costs and customer billings or authorized revenue meant to
recover those costs. To the extent these differences are probable of recovery or refund, the Utility records a
regulatory balancing account asset or liability, respectively and the differences do not have an impact on net income.
For further discussion, see ‘‘Revenue Recognition’’ below.
To the extent that portions of the Utility’s operations cease to be subject to cost-of-service rate regulation, or
recovery is no longer probable as a result of changes in regulation or other reasons, the related regulatory assets and
liabilities are written off.
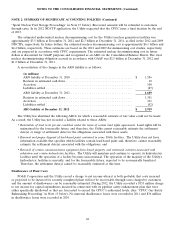
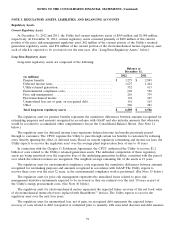
Intangible Assets
Intangible assets primarily consist of hydroelectric facility licenses with terms ranging from 19 to 53 years. The
gross carrying amount of intangible assets was $110 million at December 31, 2012 and $112 million at December 31,
2011. The accumulated amortization was $49 million at December 31, 2012 and $47 million at December 31, 2011.
The Utility’s amortization expense related to intangible assets was $2 million in 2012, $3 million in 2011, and
$4 million in 2010. The estimated annual amortization expense for 2013 through 2017 based on the December 31,
2012 intangible assets balance is $3 million. Intangible assets are recorded to other noncurrent assets—other in the
Consolidated Balance Sheets.
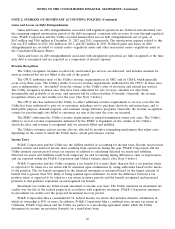
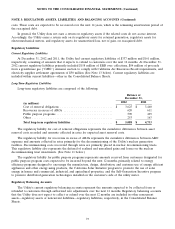
Asset Retirement Obligations
PG&E Corporation and the Utility record an ARO at discounted fair value in the period in which the obligation
is incurred if the discounted fair value can be reasonably estimated. In the same period, the associated asset
retirement costs are capitalized as part of the carrying amount of the related long-lived asset. In each subsequent
period, the ARO is accreted to its present value. PG&E Corporation and the Utility also record an ARO if a legal
obligation to perform an asset removal exists and can be reasonably estimated, but performance is conditional upon
a future event. The Utility recognizes timing differences between the recognition of costs and the costs recovered
through the ratemaking process as regulatory assets or liabilities. (See Note 3 below.) The Utility has an ARO
primarily for its nuclear generation facilities, certain fossil fuel-fired generation facilities, and gas transmission system
assets.
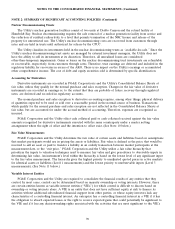
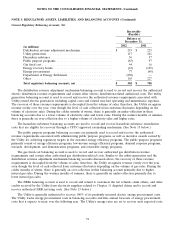
Detailed studies of the cost to decommission the Utility’s nuclear generation facilities are conducted every three
years in conjunction with the Nuclear Decommissioning Cost Triennial Proceedings (‘‘NDCTP’’) conducted by the
CPUC. In December 2012, the Utility submitted its updated decommissioning cost estimate with the CPUC. The
estimated undiscounted cost to decommission the Utility’s nuclear power plants increased by $1.4 billion due to
higher spent nuclear fuel disposal costs and an increase in the scope of work. The decommissioning cost estimates
are based on the plant location and cost characteristics for the Utility’s nuclear generation facilities. Actual
decommissioning costs may vary from these estimates as a result of changes in assumptions such as decommissioning
dates; regulatory requirements; technology; and costs of labor, materials, and equipment. The Utility recovers its
revenue requirements for decommissioning costs from customers through a non-bypassable charge that the Utility
expects will continue until those costs are fully recovered. A significant portion of the increase in decommissioning
cost estimates is due to the need to develop on-site storage for spent nuclear fuel because the federal government
has failed to meet its obligation to develop a permanent repository for the disposal of nuclear waste from nuclear
facilities in the United States. The Utility expects that it will recover its future on-site storage costs from the federal
government. The Utility already has recovered $266 million for spent nuclear fuel costs incurred through 2010. (See
67