Nissan 2013 Annual Report Download - page 7
Download and view the complete annual report
Please find page 7 of the 2013 Nissan annual report below. You can navigate through the pages in the report by either clicking on the pages listed below, or by using the keyword search tool below to find specific information within the annual report.-
 1
1 -
 2
2 -
 3
3 -
 4
4 -
 5
5 -
 6
6 -
 7
7 -
 8
8 -
 9
9 -
 10
10 -
 11
11 -
 12
12 -
 13
13 -
 14
14 -
 15
15 -
 16
16 -
 17
17 -
 18
18 -
19
-
20
-
21
-
22
-
23
-
24
-
25
-
26
-
27
-
28
-
29
-
30
-
31
-
32
-
33
-
34
-
35
-
36
-
37
-
38
-
39
-
40
-
41
-
42
-
43
-
44
-
45
-
46
 |
 |
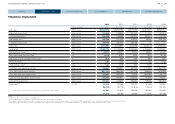
2012 2011 2010 2009 2008
For the years ended Mar. 31, 2013 Mar. 31, 2012 Mar. 31, 2011 Mar. 31, 2010 Mar. 31, 2009
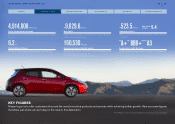
Net sales*1 Millions of yen ¥9,629,574 ¥9,409,026 ¥8,773,093 ¥7,517,277 ¥8,436,974
Operating income (loss) Millions of yen 523,544 545,839 537,467 311,609 (137,921)
Ordinary income (loss) Millions of yen 529,320 535,090 537,814 207,747 (172,740)
Net income (loss) Millions of yen 342,446 341,433 319,221 42,390 (233,709)
Comprehensive income Millions of yen 734,657 290,600 189,198
- -
Net assets Millions of yen 4,073,993 3,449,997 3,273,783 3,015,105 2,926,053
Total assets Millions of yen 12,805,170 11,072,053 10,736,693 10,214,820 10,239,540
Net assets per share yen 890.73 750.77 703.16 663.90 644.60
Basic net income (loss) per share yen 81.70 81.67 76.44 10.40 (57.38)
Net assets as a percentage of total assets %29.2 28.4 27.4 26.5 25.6
Return on equity %9.95 11.22 11.30 1.59 (7.62)
Price earnings ratio*2 Times 11.08 10.79 9.65 77.02
-
Cash flows from operating activities Millions of yen 390,897 696,297 667,502 1,177,226 890,726
Cash flows from investing activities Millions of yen (957,137) (685,053) (331,118) (496,532) (573,584)
Cash flows from financing activities Millions of yen 455,627 (308,457) 110,575 (663,989) (135,013)
Cash and cash equivalents at end of year Millions of yen 798,361 840,871 1,153,453 761,495 746,912
Net cash (Auto business) Millions of yen 915,861 619,863 293,254 (29,658) (387,882)
Employees *3 *4 Number 160,530 157,365 155,099 151,698 155,659
(36,449) (34,775) (27,816) (17,600) (20,107)
( ) represents the number of part-time employees not included in the above numbers 166,881 161,513 159,398 157,624 160,422
(37,314) (35,099) (28,089) (17,908) (20,649)
Notes:
*1 Net sales are presented exclusive of consumption tax.
*2 Price earnings ratio for fiscal 2008 is not presented because a net loss per share is recorded.
*3 The number of part-time employees has been changed to present the average number of part-time employees for the fiscal 2008 compared with the year-end part-time employees for the previous fiscal years.
*4 Staff numbers, which are presented as the lower numbers in the “Employees” line, include those of unconsolidated subsidiaries accounted for by the equity method as reference data.
FINANCIAL HIGHLIGHTS
06
NISSAN MOTOR COMPANY ANNUAL REPORT 2013
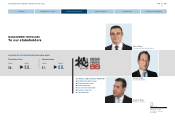
CORPORATE FACE TIME
CONTENTS
MANAGEMENT MESSAGES
PERFORMANCE
CORPORATE GOVERNANCE
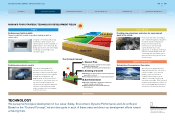
NISSAN POWER 88