Nissan 2013 Annual Report Download - page 27
Download and view the complete annual report
Please find page 27 of the 2013 Nissan annual report below. You can navigate through the pages in the report by either clicking on the pages listed below, or by using the keyword search tool below to find specific information within the annual report.-
 1
1 -
2
-
3
-
4
-
5
-
6
-
7
-
8
-
9
-
10
-
11
-
12
-
13
-
14
-
15
-
16
-
 17
17 -
 18
18 -
 19
19 -
 20
20 -
 21
21 -
 22
22 -
 23
23 -
 24
24 -
 25
25 -
 26
26 -
 27
27 -
 28
28 -
 29
29 -
 30
30 -
 31
31 -
 32
32 -
 33
33 -
 34
34 -
 35
35 -
 36
36 -
 37
37 -
38
-
39
-
40
-
41
-
42
-
43
-
44
-
45
-
46
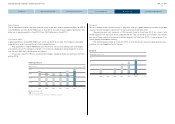
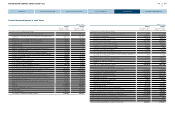
 |
 |
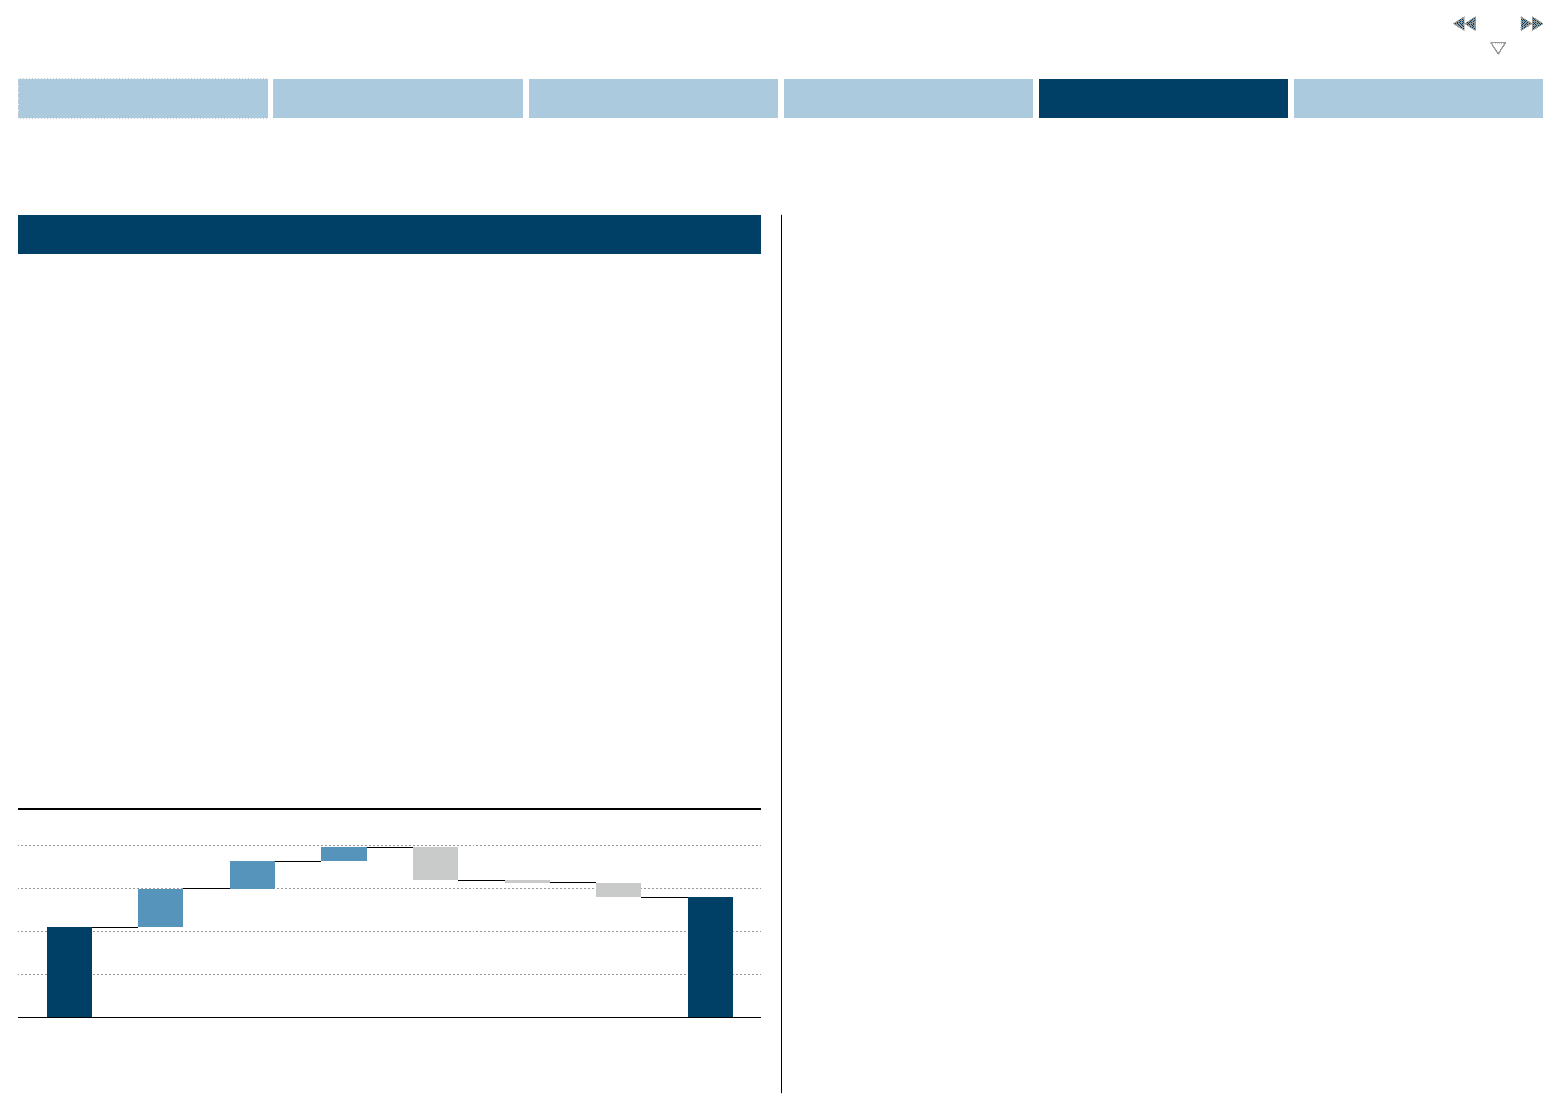
523.5
+225.0
+160.0
+80.0 –190.0
–15.0 –83.5
700.0
Impact on Operating Profits (FY2013 Pro Forma Outlook)
(Billions of yen)
* Based on continuation of proportional consolidation of China JV
Operating profit variance analysis
l The positive impact from foreign exchange is forecast at 225 billion yen, with the U.S. dollar accounting
for the majority of this variance.
l The result of the purchasing cost reduction (including raw material) efforts is expected to be a positive
160 billion yen.
l Volume and mix are expected to produce a positive impact of 80 billion yen as a result of the growth in
global sales volume.
l We anticipate the increase in selling and pricing-related expenses to be a negative 190 billion yen.
l Sales finance is expected to be a negative 15 billion yen.
l Costs allocated for future growth and other items are expected to be a negative 83.5 billion yen.
Under the forecast of consolidated operating results for fiscal year 2013, the consolidation method of
Dongfeng Motor Co., Ltd. is changed from a proportionate consolidation to equity method in comparison
with the results until fiscal year 2012 by the adoption of IFRS 11. This change has no impact on net
income though there are effects on net sales, operating income and ordinary income.
<FY 2013 Outlook − Tokyo Stock Exchange filling base>
n Net sales 10.37 trillion yen
n Operating income 610.0 billion yen
n Net income 420.0 billion yen
n Capital expenditures 520.0 billion yen
n R&D expenses 508.0 billion yen
Through the adoption of IFRS 11, operating income is expected to be decreased by 90.0 billion yen.
(All figures for fiscal 2013 are forecasts, as of May 10, 2013.)
FISCAL 2013 OUTLOOK
In our outlook for fiscal year 2013, we expect our global sales to reach 5.3 million units, an increase of
7.8%, which is another record level for Nissan.
With a total industry volume assumption of 81.1 million units, a 2.2 % increase year on year, our
global market share is expected to grow from 6.2% to 6.5%.
In consequence of our plan, financial forecast is as follows. We have used a foreign exchange rate
assumption of 95 yen to the dollar and 122 yen to the euro:
<FY 2013 Nissan`s pro forma outlook>
n Net sales 11.2 trillion yen
n Operating income 700.0 billion yen
n Net income 420.0 billion yen
Nissan is on track to grow by 386,000 units during fiscal year 2013 – which will move us toward our
objective of an 8% global market share by fiscal year 2016 to achieve Nissan Power 88. In support of this
growth plan, necessary investments in R&D and capital expenditures are being made to support the
long-term expansion of the company.
With these factors included, the expected variance in operating profit between 2012 and 2013 is
broken down as follows:
FY12
O.P.
Actual
Purch. cost
reduction
(Including raw
material)
Volume/mix Sales financeFOREX Selling &
pricing related
expenses
Cost for future
growth & Others
FY13
O.P.
Pro forma
outlook
26
NISSAN MOTOR COMPANY ANNUAL REPORT 2013
PERFORMANCE
NISSAN POWER 88
CORPORATE GOVERNANCE
CONTENTS
MANAGEMENT MESSAGES
CORPORATE FACE TIME
NISSAN POWER 88