Nissan 2013 Annual Report Download - page 30
Download and view the complete annual report
Please find page 30 of the 2013 Nissan annual report below. You can navigate through the pages in the report by either clicking on the pages listed below, or by using the keyword search tool below to find specific information within the annual report.-
 1
1 -
2
-
3
-
4
-
5
-
6
-
7
-
8
-
9
-
10
-
11
-
12
-
13
-
14
-
15
-
16
-
17
-
18
-
19
-
 20
20 -
 21
21 -
 22
22 -
 23
23 -
 24
24 -
 25
25 -
 26
26 -
 27
27 -
 28
28 -
 29
29 -
 30
30 -
 31
31 -
 32
32 -
 33
33 -
 34
34 -
 35
35 -
 36
36 -
 37
37 -
 38
38 -
 39
39 -
 40
40 -
41
-
42
-
43
-
44
-
45
-
46
 |
 |
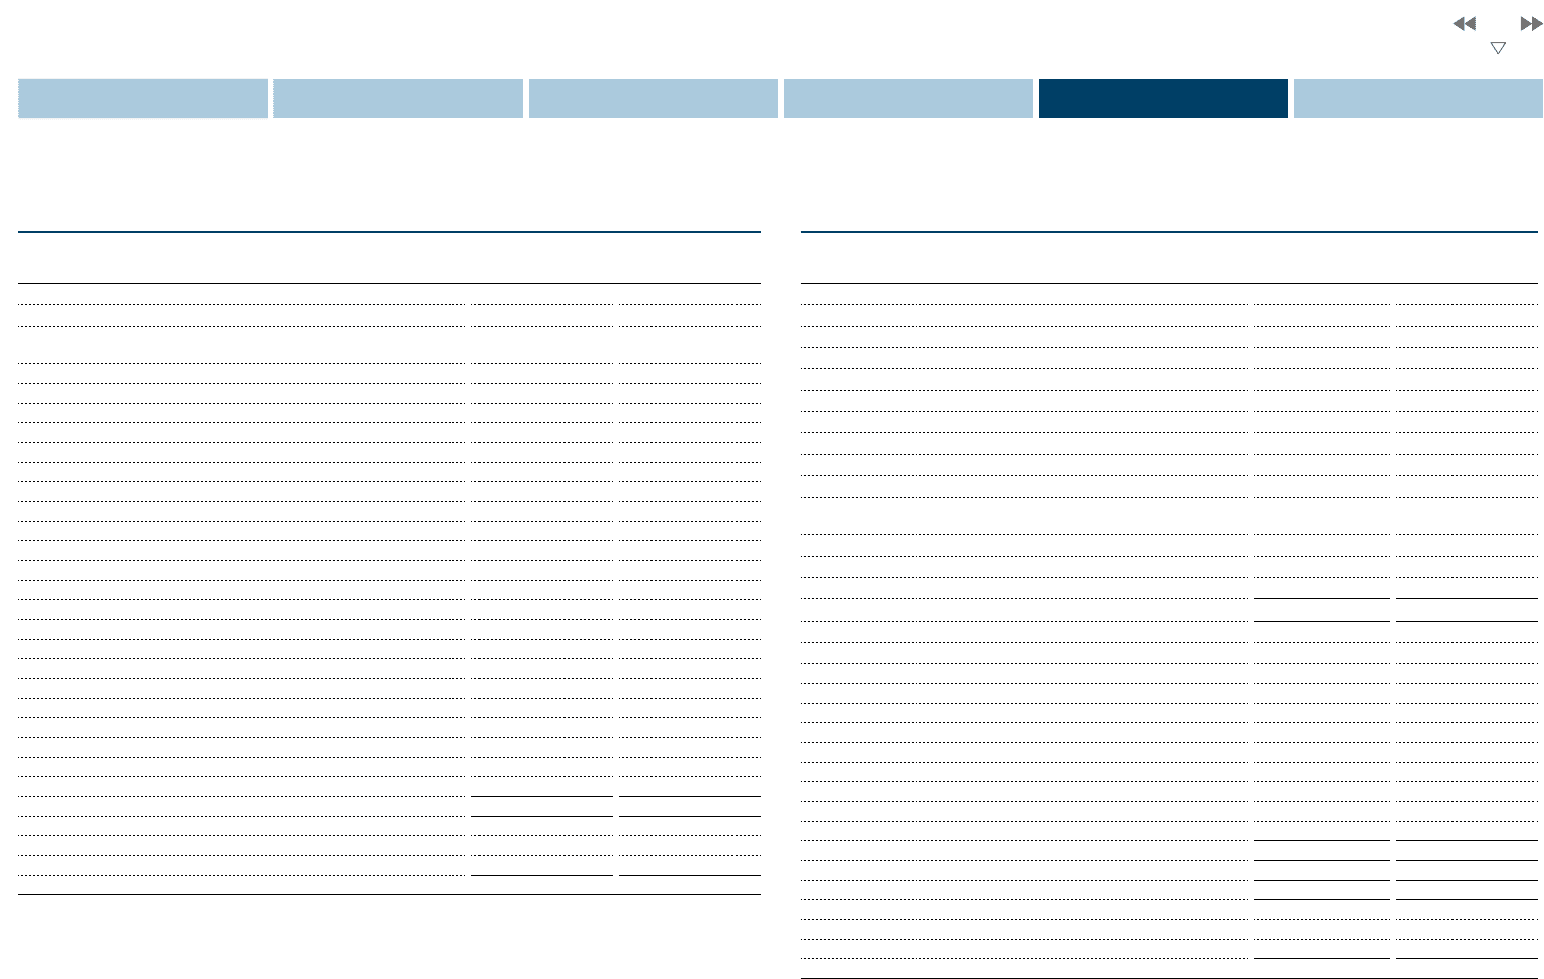
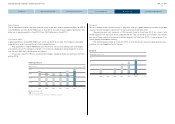
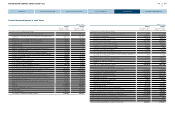
Consolidated statement of cash flows
(Millions of yen)
FY2011
(From April 1, 2011
To March 31, 2012)
FY2012
(From April 1, 2012
To March 31, 2013)
Cash flows from operating activities
Income before income taxes and minority interests 529,329 516,714
Depreciation and amortization (for fixed assets excluding leased
vehicles) 364,122 352,376
Depreciation and amortization (for other assets) 20,852 18,836
Depreciation and amortization (for leased vehicles) 195,370 219,155
Impairment loss 12,117 12,352
Loss on disaster 8,245
-
Gain on contribution of securities to retirement benefit trust (7,048)
-
Gain on negative goodwill (24,086) (110)
Increase (decrease) in allowance for doubtful receivables (23,968) (6,112)
Provision for residual value risk of leased vehicles(net changes) 10,095 12,378
Interest and dividend income (22,950) (19,712)
Interest expense 87,890 85,183
Loss (gain) on sales of fixed assets (6,792) (9,401)
Loss on disposal of fixed assets 7,106 8,247
Loss (gain) on sales of investment securities (10,624) (1,564)
Loss (gain) on transfer of business
-
(8,070)
Decrease (increase) in trade notes and accounts receivable (89,495) 123,816
Decrease (increase) in sales finance receivables (432,957) (561,046)
Decrease (increase) in inventories (70,615) 10,408
Increase (decrease) in trade notes and accounts payable 317,945 (147,345)
Amortization of net retirement benefit obligation at transition 10,146 9,947
Retirement benefit expenses 55,141 30,324
Retirement benefit payments made against related accrual (62,695) (46,178)
Other (2,051) (33,152)
Subtotal 865,077 567,046
Interest and dividends received 23,070 20,143
Interest paid (85,398) (87,798)
Income taxes paid (106,452) (108,494)
Net cash provided by operating activities 696,297 390,897
(Millions of yen)
FY2011
(From April 1, 2011
To March 31, 2012)
FY2012
(From April 1, 2012
To March 31, 2013)
Cash flows from investing activities
Net decrease (increase) in short-term investments 1,597 24
Purchase of fixed assets (400,623) (526,818)
Proceeds from sales of fixed assets 27,458 60,255
Purchase of leased vehicles (625,646) (709,995)
Proceeds from sales of leased vehicles 317,211 323,615
Payments of long-term loans receivable (4,222) (8,439)
Collection of long-term loans receivable 22,816 239
Purchase of investment securities (17,340) (34,155)
Proceeds from sales of investment securities 6,124 2,332
Proceeds from sales of subsidiaries' shares resulting in changes in
the scope of consolidation 537 15,106
Net decrease (increase) in restricted cash 17,336 (14,722)
Payment for transfer of business
-
(56,644)
Other (30,301) (7,935)
Net cash used in investing activities (685,053) (957,137)
Cash flows from financing activities
Net increase (decrease) in short-term borrowings (536,782) 377,439
Proceeds from long-term borrowings 1,379,490 1,122,914
Proceeds from issuance of bonds 135,329 242,754
Repayment of long-term borrowings (1,034,056) (952,145)
Redemption of bonds (88,459) (182,877)
Proceeds from minority shareholders 2,606 9,942
Purchase of treasury stock (9,015) (7)
Repayment of lease obligations (81,118) (52,944)
Cash dividends paid (62,748) (94,306)
Cash dividends paid to minority shareholders (13,704) (15,143)
Net cash provided by (used in) financing activities (308,457) 455,627
Effects of exchange rate changes on cash and cash equivalents (15,630) 67,723
Increase (decrease) in cash and cash equivalents (312,843) (42,890)
Cash and cash equivalents at beginning of the period 1,153,453 840,871
Increase due to inclusion in consolidation 261 548
Decrease due to exclusion in consolidation
-
(168)
Cash and cash equivalents at end of the period 840,871 798,361
29
NISSAN MOTOR COMPANY ANNUAL REPORT 2013
PERFORMANCE
NISSAN MOTOR COMPANY ANNUAL REPORT 2013
NISSAN POWER 88
CORPORATE GOVERNANCE
CONTENTS
MANAGEMENT MESSAGES
CORPORATE FACE TIME
NISSAN POWER 88