Nissan 2013 Annual Report Download - page 5
Download and view the complete annual report
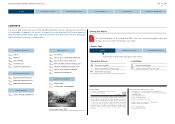
Please find page 5 of the 2013 Nissan annual report below. You can navigate through the pages in the report by either clicking on the pages listed below, or by using the keyword search tool below to find specific information within the annual report.-
 1
1 -
 2
2 -
 3
3 -
 4
4 -
 5
5 -
 6
6 -
 7
7 -
 8
8 -
 9
9 -
 10
10 -
 11
11 -
 12
12 -
 13
13 -
 14
14 -
 15
15 -
 16
16 -
17
-
18
-
19
-
20
-
21
-
22
-
23
-
24
-
25
-
26
-
27
-
28
-
29
-
30
-
31
-
32
-
33
-
34
-
35
-
36
-
37
-
38
-
39
-
40
-
41
-
42
-
43
-
44
-
45
-
46
 |
 |
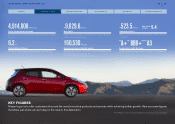
KEY FIGURES
Nissan’s goal is to offer customers all around the world innovative products and services while achieving further growth. Here are some figures
that show just where we are today on the road to this destination.
*Note: All figures cover the fiscal year ending March 31, 2013, and are current as of that date.
4,914,000Vehicles
Total Global Retail Volume
During fiscal 2012 we rolled out 10 new models and achieved our highest
sales ever.
6.2%
Global Market Share
Our goal is to achieve 8% global market share by the end of fiscal 2016.
¥9,629.6Billion
Net Sales
Growth in vehicle sales numbers and easing of the strong yen brought about a
2.3% increase from the previous year.
160,530People
Employees (consolidated basis)
We have production facilities in 20 countries and regions worldwide and offer
our products and services in more than 160.
(As of March 31, 2012 excluding employees number)
¥523.5Billion 5.4%
Operating Profit
We aim to achieve a sustainable operating margin of 8% by the end of
fiscal 2016.
A+ BBB+ A3
Long-term Credit Ratings
During fiscal 2012 we saw improvement in our ratings from R&I and Moody’s.
R&I S&P MOODY’S
Operating
margin
04
NISSAN MOTOR COMPANY ANNUAL REPORT 2013
CORPORATE FACE TIME
MANAGEMENT MESSAGES
PERFORMANCE
CORPORATE GOVERNANCE
CONTENTS
NISSAN POWER 88