Nissan 2013 Annual Report Download - page 29
Download and view the complete annual report
Please find page 29 of the 2013 Nissan annual report below. You can navigate through the pages in the report by either clicking on the pages listed below, or by using the keyword search tool below to find specific information within the annual report.-
 1
1 -
2
-
3
-
4
-
5
-
6
-
7
-
8
-
9
-
10
-
11
-
12
-
13
-
14
-
15
-
16
-
17
-
18
-
 19
19 -
 20
20 -
 21
21 -
 22
22 -
 23
23 -
 24
24 -
 25
25 -
 26
26 -
 27
27 -
 28
28 -
 29
29 -
 30
30 -
 31
31 -
 32
32 -
 33
33 -
 34
34 -
 35
35 -
 36
36 -
 37
37 -
 38
38 -
 39
39 -
40
-
41
-
42
-
43
-
44
-
45
-
46
 |
 |

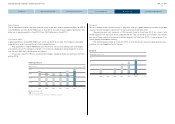
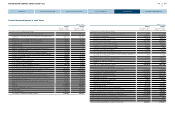
Consolidated statement of income
(Millions of yen)
FY2011
(From April 1, 2011
To March 31, 2012)
FY2012
(From April 1, 2012
To March 31, 2013)
Net sales 9,409,026 9,629,574
Cost of sales 7,772,832 8,022,658
Gross profit 1,636,194 1,606,916
Selling, general and administrative expenses
Advertising expenses 203,650 229,067
Service costs 66,181 55,099
Provision for warranty costs 77,278 71,320
Other selling expenses 141,508 131,660
Salaries and wages 333,745 329,771
Retirement benefit expenses 24,630 11,855
Supplies 5,445 4,544
Depreciation and amortization 48,718 48,361
Provision for doubtful accounts or reversal of provision for doubtful
accounts (8,127) 6,199
Amortization of goodwill 5,251 4,612
Other 192,076 190,884
Total selling, general and administrative expenses 1,090,355 1,083,372
Operating income 545,839 523,544
Non-operating income
Interest income 17,174 14,866
Dividends income 5,776 4,846
Equity in earnings of affiliates 19,103 11,643
Exchange gain 14,756 19,388
Miscellaneous income 12,343 15,279
Total non-operating income 69,152 66,022
Non-operating expenses
Interest expense 32,892 27,471
Amortization of net retirement benefit obligation at transition 10,146 9,947
Derivative loss 20,816 6,360
Miscellaneous expenses 16,047 16,468
Total non-operating expenses 79,901 60,246
Ordinary income 535,090 529,320
(Millions of yen)
FY2011
(From April 1, 2011
To March 31, 2012)
FY2012
(From April 1, 2012
To March 31, 2013)
Special gains
Gain on sales of fixed assets 8,716 10,998
Gain on sales of investment securities 10,643 1,597
Gain on negative goodwill 24,086 110
Gain on contribution of securities to retirement benefit trust 7,048
-
Insurance income
-
1,082
Gain on transfer of business
-
8,070
Other 5,498 1,753
Total special gains 55,991 23,610
Special losses
Loss on sale of fixed assets 1,924 1,597
Loss on disposal of fixed assets 7,106 8,247
Impairment loss 12,117 12,352
Loss on disaster 29,867
-
Other 10,738 14,020
Total special losses 61,752 36,216
Income before income taxes and minority interests 529,329 516,714
Income taxes-current 115,185 105,659
Income taxes-deferred 36,321 40,692
Total income taxes 151,506 146,351
Income before minority interests 377,823 370,363
Income attributable to minority interests 36,390 27,917
Net income 341,433 342,446
28
NISSAN MOTOR COMPANY ANNUAL REPORT 2013
PERFORMANCE
NISSAN POWER 88
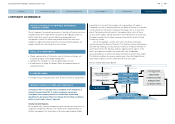
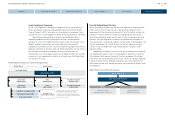
CORPORATE GOVERNANCE
CONTENTS
MANAGEMENT MESSAGES
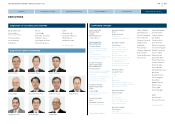
CORPORATE FACE TIME
NISSAN POWER 88