Nissan 2013 Annual Report Download - page 38
Download and view the complete annual report
Please find page 38 of the 2013 Nissan annual report below. You can navigate through the pages in the report by either clicking on the pages listed below, or by using the keyword search tool below to find specific information within the annual report.-
 1
1 -
2
-
3
-
4
-
5
-
6
-
7
-
8
-
9
-
10
-
11
-
12
-
13
-
14
-
15
-
16
-
17
-
18
-
19
-
20
-
21
-
22
-
23
-
24
-
25
-
26
-
27
-
 28
28 -
 29
29 -
 30
30 -
 31
31 -
 32
32 -
 33
33 -
 34
34 -
 35
35 -
 36
36 -
 37
37 -
 38
38 -
 39
39 -
 40
40 -
 41
41 -
 42
42 -
 43
43 -
 44
44 -
 45
45 -
 46
46
 |
 |
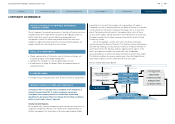
through several measures including keeping adequate liquidity in the form of
cash and unutilized committed lines, unencumbered assets (mainly vehicle
loans and leases), liquidity support from auto operations to the extent we have
excess cash in auto operations, diversified funding sources and geographical
diversification of capital market access.
As of March 31, 2013, sales finance companies’ liquidity (cash and
unutilized committed lines) was approximately ¥538 billion. Additionally, we
have a healthy mix of secured (30.8%) and unsecured and other (69.2%)
funding sources, which ensure a stronger balance sheet and incremental
liquidity through utilization of unencumbered assets.
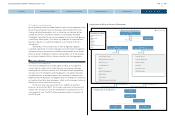
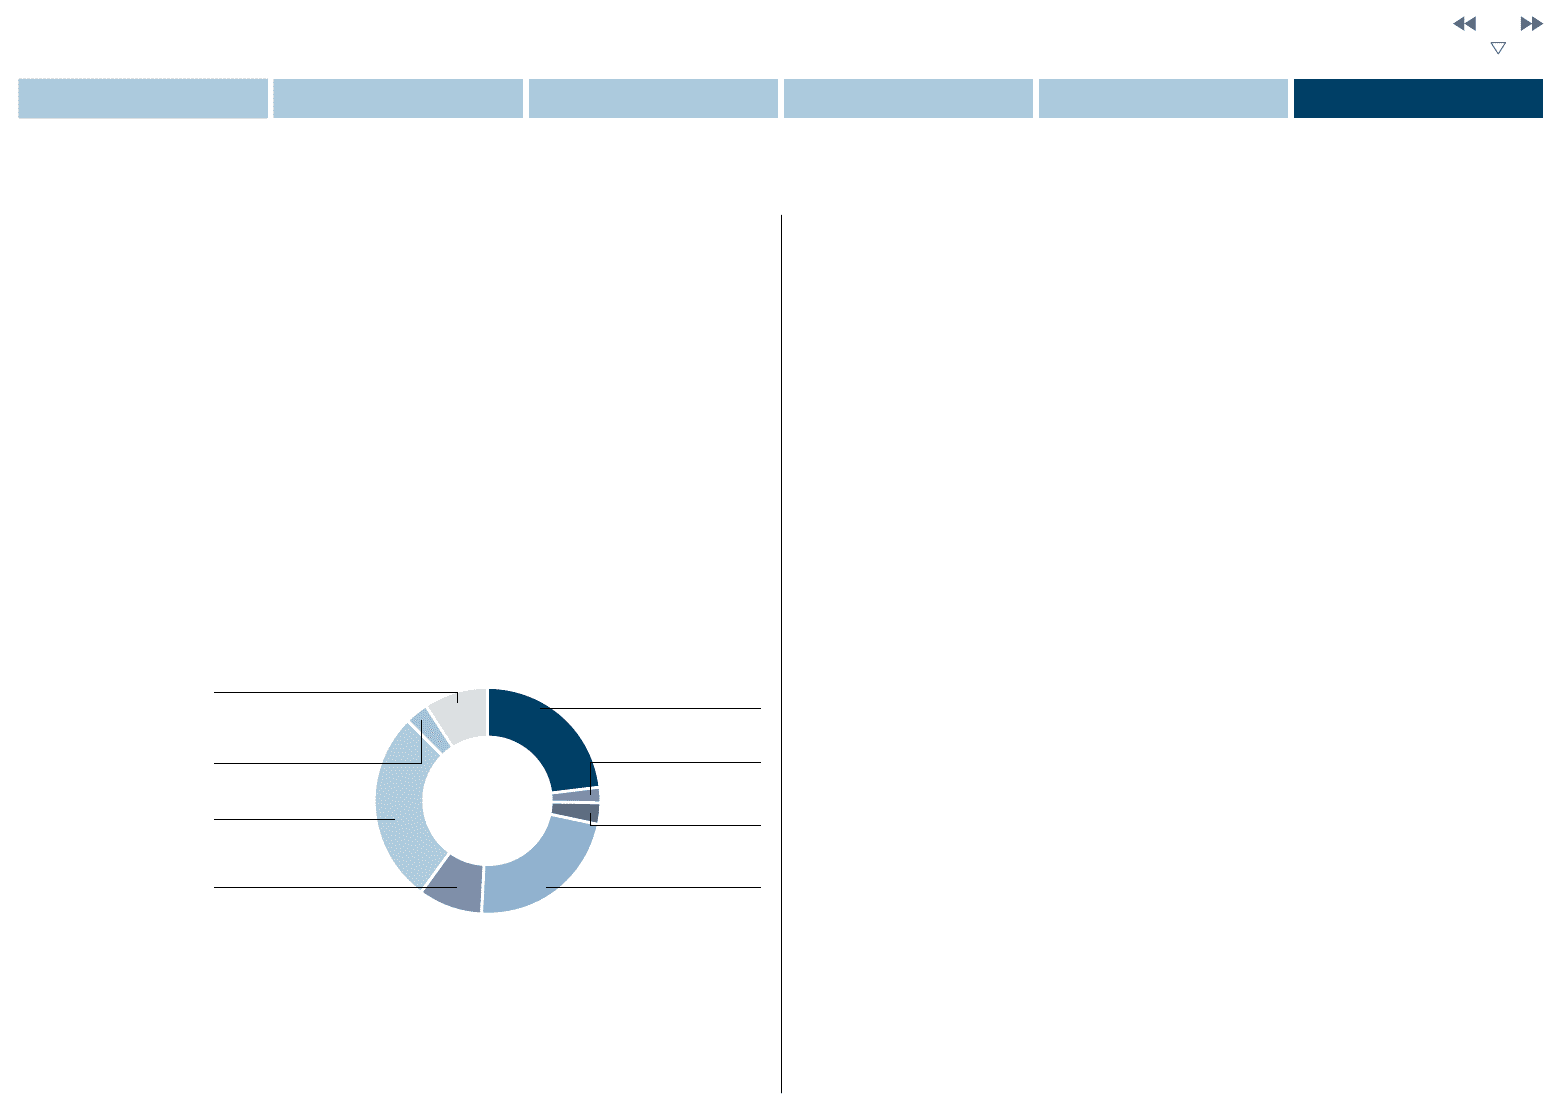
The pie chart below describes our diversified funding sources in sales
finance business.
During fiscal year 2012, we were able to raise new funding through
bank loans, asset-backed securities, asset-backed commercial paper,
commercial paper and bonds reflecting our diversified access to
financing instruments.
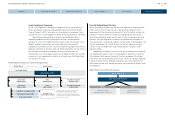
2. Interest Rate Risk Management
The sales financing business is exposed to interest rate risks. Interest rate risk
is defined as the potential variance in the earnings of an entity or the fair value
of the portfolio that would result from a fluctuation in the general level of
market interest rates where funds with differing fixed-rate periods or differing
terms are financed and invested.
Nissan measures the risks by using the sensitivity analysis with various
interest rate scenarios and determines the risk tolerance level. Nissan
controls the interest rate maturities of both assets and liabilities to maintain
the risks within an acceptable tolerance level.
The sensitivity analysis mentioned above uses statistical models, such as
the Monte Carlo Simulation Method. However, the actual fluctuation of market
interest rates and its impact may deviate significantly from the assumptions
used in the models. Nissan enters into interest rate derivative financial
instruments to maintain the potential variability of interest rates at the desired
level of risk exposure. The main objective of these transactions is to mitigate
the risks and not to pursue speculative profit maximization.
3. Credit Risks
Nissan is exposed to the risks of failure to recover the full value of financial
receivables for its Auto credit and Lease business with retail customers and
for its Dealer finance business, due to changes in the economic situation and
credit quality of customers. Nissan manages the credit risks closely by
establishing an effective screening and collection system and structure. Credit
applicants are all subject to credit assessments of their creditworthiness
under a detailed scoring system. Based on the information directly obtained
from applicants and from credit bureaus, loan authorization is made in a
comprehensive manner by considering the following points: applicant’s credit
history; applicant’s capacity to pay, which is estimated by debt ratio, payment
to income ratio and disposable income; applicant’s stability; and loan
conditions including the loan collateral, loan advance and payment terms. In
addition to carrying out this screening process, whenever required, Nissan
takes into account qualitative information by conducting field visits to
customers or referring to past business records with Nissan in accordance
with characteristics of regional business practices and risks.
Sales Finance Business Funding Sources (As of March 2013)
Group Finance
(Inter-Company)
23.1%
Equity
9.0%
Commercial Paper
2.3%
ABS off B/S
3.3%
S/T Loan
3.0%
ABS on B/S
27.5%
L/T Loan
22.7%
Bonds
9.1%
37
CORPORATE GOVERNANCE
NISSAN MOTOR COMPANY ANNUAL REPORT 2013
CONTENTS
MANAGEMENT MESSAGES
CORPORATE FACE TIME
PERFORMANCE
NISSAN POWER 88