Nissan 2013 Annual Report Download - page 24
Download and view the complete annual report
Please find page 24 of the 2013 Nissan annual report below. You can navigate through the pages in the report by either clicking on the pages listed below, or by using the keyword search tool below to find specific information within the annual report.-
 1
1 -
2
-
3
-
4
-
5
-
6
-
7
-
8
-
9
-
10
-
11
-
12
-
13
-
 14
14 -
 15
15 -
 16
16 -
 17
17 -
 18
18 -
 19
19 -
 20
20 -
 21
21 -
 22
22 -
 23
23 -
 24
24 -
 25
25 -
 26
26 -
 27
27 -
 28
28 -
 29
29 -
 30
30 -
 31
31 -
 32
32 -
 33
33 -
 34
34 -
35
-
36
-
37
-
38
-
39
-
40
-
41
-
42
-
43
-
44
-
45
-
46
 |
 |
545.8 523.5
–57.2 –53.5 –37.0 –53.7 +0.2 –41.7
+30.2 +190.4
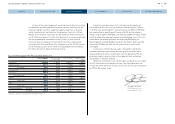
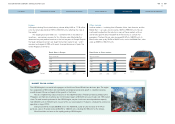
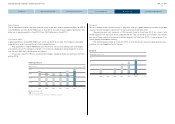
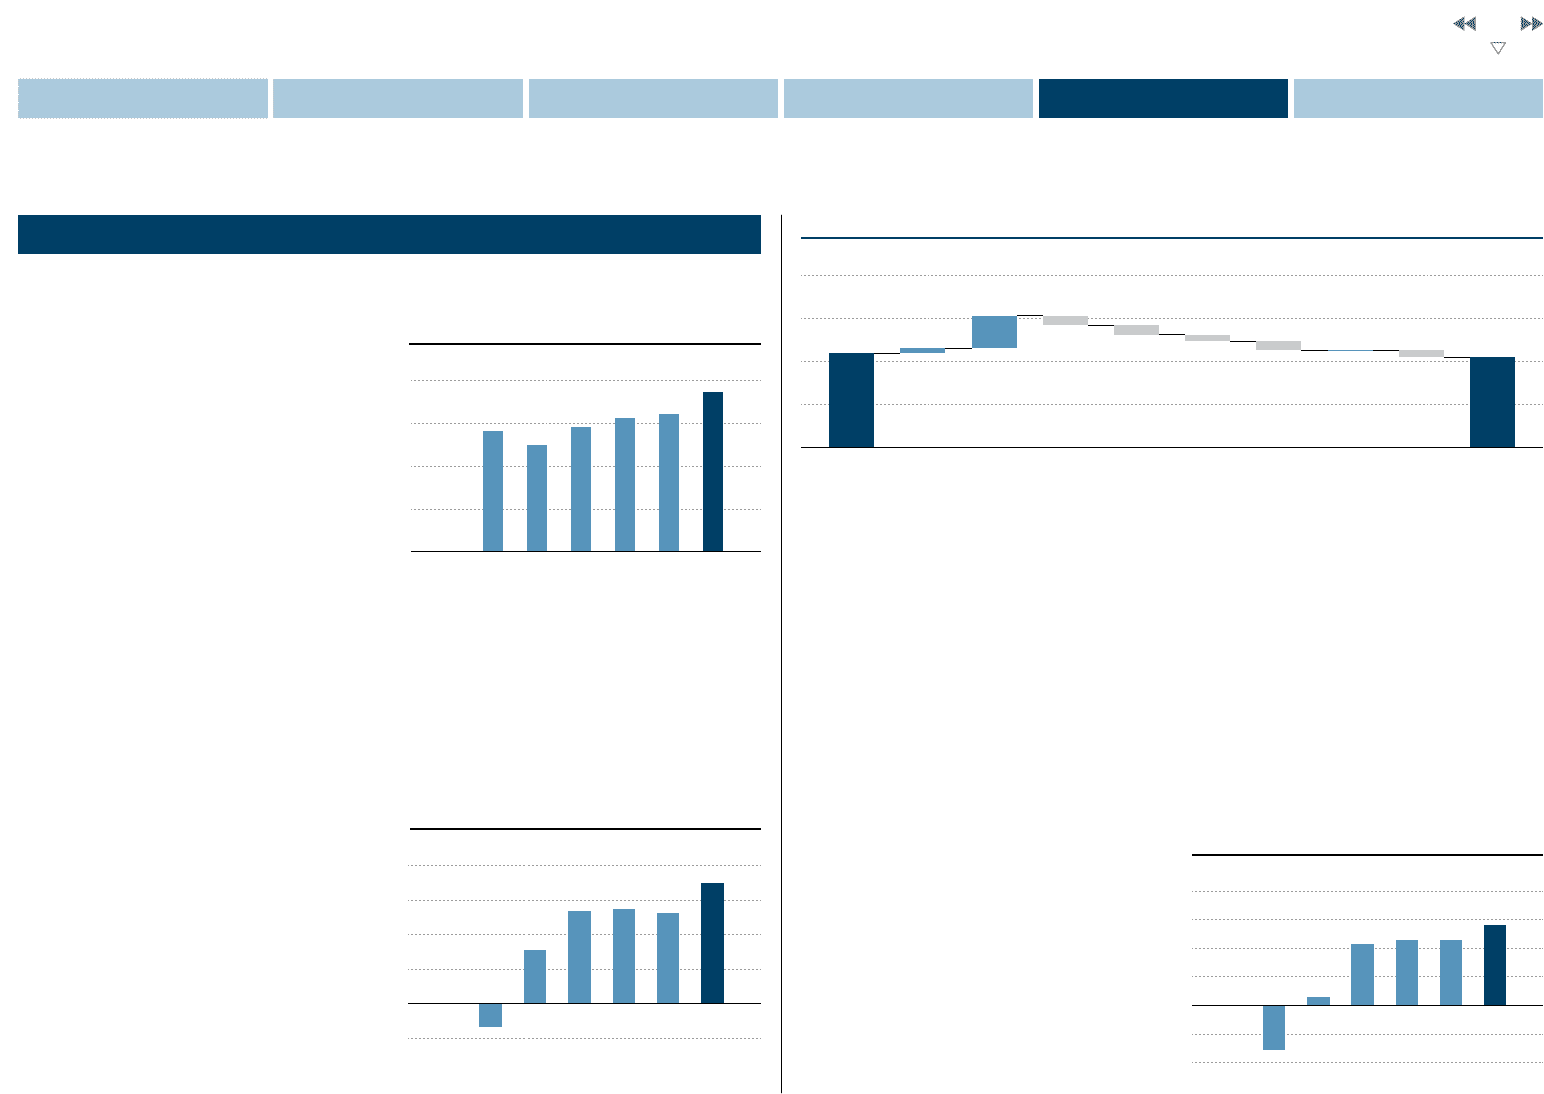
FISCAL 2012 FINANCIAL REVIEW
Net Sales
For fiscal year 2012, consolidated net sales
increased 2.3%, to 9.630 trillion yen.
Operating Profit
Consolidated operating profit totaled 523.5 billion yen, a decrease of 4.1% from last year. In comparison
to last year’s consolidated operating profit, the variance was due to the following factors:
l The 30.2 billion yen positive impact from foreign exchange came mainly from the US dollar.
l Purchasing cost reduction efforts including raw material costs resulted in a net savings of 190.4
billion yen.
l Volume and mix produced a negative impact of 57.2 billion yen.
l The increase in selling expenses resulted in a
53.5 billion yen negative movement.
l R&D expenses increased by 37.0 billion yen.
l Manufacturing expenses increased by 53.7
billion yen.
l Sales financing profit increased slightly by 0.2
billion yen.
l Other items, which consisted primarily of a
decrease in profits from affiliated companies
and Japan Dealer Companies, lower
remarketing gains, and higher importation costs
in Brazil due to changes in the Brazil-Mexico
Free Trade Agreement, resulted in a negative
impact of 41.7 billion yen.
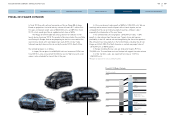
Net income
Net non-operating profit improved 16.5 billion yen from negative 10.7 billion yen to positive 5.8 billion yen
in fiscal 2012. The positive impact came from derivative loss by 14.4 billion yen, from negative 20.8
billion yen to 6.4 billion yen in fiscal 2012. As a result, ordinary profit totaled 529.3 billion yen, which was
deteriorated by 5.8 billion yen from 535.1 billion yen in fiscal 2011.
Net extraordinary losses totaled 12.6 billion yen, a deterioration of 6.8 billion yen from the previous
year’s loss of 5.8 billion yen. This deterioration was due mainly to the negative impacts such as decrease
in gain on negative goodwill by 24.0 billion yen and in gain on sales of investment securities by 9.0 billion
yen, despite the positive impact in decrease of loss on disaster by 29.9 billion yen.
Taxes totaled 146.3 billion yen, a decrease of 5.2 billion yen from fiscal 2011. Minority interests had
a negative contribution of 28.0 billion yen in fiscal 2012.
Net income reached 342.4 billion yen, an increase of 1.0 billion yen from fiscal 2011.
FISCAL 2012 FINANCIAL PERFORMANCE Impact on Operating Profit
(Billions of yen)
FY11
O.P.
Purch. cost
reduction
(Including raw
material)
Selling
exp.
MFG
exp.
FOREX Volume
/ mix
R&D
exp.
Sales
Finance
Other
Items
FY12
O.P.
300.0
150.0
–150.0
–300.0
0
450.0
600.0
2013201220112009 2010
42.4
–233.7
319.2 341.4 342.4
420.0
2008
Net income (loss)
(Billions of yen)
(FY)
(Forecast)
800.0
600.0
400.0
200.0
–200.0
0
2013201220112008 2009 2010
311.6
–137.9
537.5 545.8 523.5
700.0
Operating Profit (loss)
(Billions of yen)
(FY)
(Forecast)
* Based on continuation of proportional consolidation of China JV
Net Sales
(Billions of yen)
(FY)
(Forecast)
12,000.0
6,000.0
9,000.0
3,000.0
0
2013201220112009 2010
7,517.3
8,773.1
8,437.0
9,409.0 9,629.6
11,200.0
2008
23
NISSAN MOTOR COMPANY ANNUAL REPORT 2013
PERFORMANCE
NISSAN POWER 88
CORPORATE GOVERNANCE
CONTENTS
MANAGEMENT MESSAGES
CORPORATE FACE TIME
NISSAN POWER 88