Nissan 2013 Annual Report Download - page 16
Download and view the complete annual report
Please find page 16 of the 2013 Nissan annual report below. You can navigate through the pages in the report by either clicking on the pages listed below, or by using the keyword search tool below to find specific information within the annual report.-
 1
1 -
2
-
3
-
4
-
5
-
 6
6 -
 7
7 -
 8
8 -
 9
9 -
 10
10 -
 11
11 -
 12
12 -
 13
13 -
 14
14 -
 15
15 -
 16
16 -
 17
17 -
 18
18 -
 19
19 -
 20
20 -
 21
21 -
 22
22 -
 23
23 -
 24
24 -
 25
25 -
 26
26 -
27
-
28
-
29
-
30
-
31
-
32
-
33
-
34
-
35
-
36
-
37
-
38
-
39
-
40
-
41
-
42
-
43
-
44
-
45
-
46
 |
 |
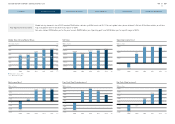
In terms of financial management, we will continue to focus on ensuring
cost efficiency, generating positive automotive free cash flow even with the
increased capital investments supporting capacity expansions in growing
markets worldwide and maintaining a strong balance sheet with sufficient
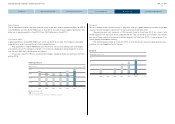
liquidity. The chart below summarizes the pro-forma key financial metrics of
our 2013 full-year forecast. I use the term “pro-forma” as we have maintained
the use of proportional consolidation of our China JV in these financial
metrics for ease in comparison to the fiscal 2012 results. Under revised
accounting rules that are effective with the beginning of the 2013 fiscal year,
we will no longer account for our China JV using proportional consolidation
but rather will switch to equity method accounting.
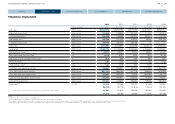
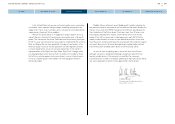
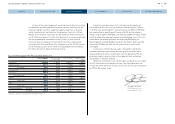
In brief, on a pro-forma basis (with continued use of proportional
consolidation for our China JV), net revenue is forecast to grow 16.3% to
11.2 trillion yen; operating profit is forecast to grow over 33% to 700 billion
yen, representing an operating profit margin of 6.3%; and net income is
forecast to grow 23% to 420 billion yen, reflecting a 3.8% net margin. Please
note that applying the new equity accounting methodology for our China JV
would reduce the forecast pro-forma net revenue by 830 billion yen.
Operating profit would be 90 billion yen lower and ordinary profit would be
reduced by 20 billion yen, while the net income amount would remain
unchanged.
In closing, our mid-term business plan is designed to significantly
enhance shareholder value through business growth that drives higher
revenue, profits and strong sustained free cash flow generation. We will
enhance enterprise value, maintain a strong balance sheet and provide
shareholders an attractive dividend.
Reflecting confidence in our mid-term plan and based on our outlook
for 2013 including continued positive Free Cash Flow generation, we
announced in May 2013 our intention to increase the fiscal 2013 dividend
by 20% to 30 yen per share.
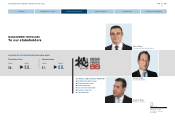
Joseph G. Peter
Chief Financial Officer
Nissan Motor Co., Ltd.
FY12 actual (A) FY13 pro-forma
outlook (B)*
Vs. FY12 (B–A) Change vs. FY12
(B/A)
Net revenue 9,629.6 11,200.0 +1,570.4 +16.3%
Operating profit 523.5 700.0 +176.5 +33.7%
OP margin 5.4% 6.3% +0.9%
Ordinary profit 529.3 665.0 +135.7 +25.6%
Net income 342.4 420.0 +77.6 +22.6%
Net income ratio 3.6% 3.8% +0.2%
CAPEX 524.5 570.0 +45.5 +8.7%
Sales ratio 5.4% 5.1% –0.3%
R&D 469.9 520.0 +50.1 +10.7%
Sales ratio 4.9% 4.6% –0.3%
FX rate assumptions JPY/USD 82.9 95.0 +12.1
JPY/EUR 106.8 122.0 +15.2
Fiscal 2013 Management Pro-Forma Outlook (billion yen)
* Based on continuation of proportional consolidation of China JV
15
NISSAN MOTOR COMPANY ANNUAL REPORT 2013
MANAGEMENT MESSAGES
CONTENTS
CORPORATE FACE TIME
PERFORMANCE
CORPORATE GOVERNANCE
NISSAN POWER 88