Nissan 2013 Annual Report Download - page 25
Download and view the complete annual report
Please find page 25 of the 2013 Nissan annual report below. You can navigate through the pages in the report by either clicking on the pages listed below, or by using the keyword search tool below to find specific information within the annual report.-
 1
1 -
2
-
3
-
4
-
5
-
6
-
7
-
8
-
9
-
10
-
11
-
12
-
13
-
14
-
 15
15 -
 16
16 -
 17
17 -
 18
18 -
 19
19 -
 20
20 -
 21
21 -
 22
22 -
 23
23 -
 24
24 -
 25
25 -
 26
26 -
 27
27 -
 28
28 -
 29
29 -
 30
30 -
 31
31 -
 32
32 -
 33
33 -
 34
34 -
 35
35 -
36
-
37
-
38
-
39
-
40
-
41
-
42
-
43
-
44
-
45
-
46
 |
 |
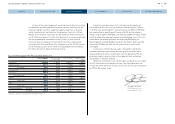
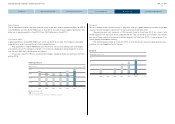
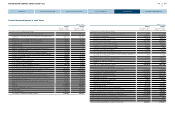
Balance sheet
Current assets have increased by 14.9% to 7,597.1 billion yen compared to March 31, 2012. This was
mainly attributable to an increase in Sales finance receivables by 951.6 billion yen, despite a decrease
in Trade notes and accounts receivable by 107.8 billion yen.
Fixed assets have increased by 16.7% to 5,208.1 billion yen compared to March 31, 2012. This was
mainly attributable to an increase in Machinery, equipment and vehicles, net by 452.4 billion yen.
As a result, Total assets have increased by 15.7% to 12,805.2 billion yen compared to March
31, 2012.
Current liabilities have increased by 10.0% to 4,560.2 billion yen compared to March 31, 2012. This
was mainly due to an increase in Short-term borrowings by 274.6 billion yen and Commercial papers by
181.0 billion yen.
Long-term liabilities have increased by 20.0% to 4,170.9 billion yen compared to March 31, 2012.
This was mainly due to an increase in Long-term borrowings by 474.5 billion yen.
As a result, Total liabilities have increased by 14.6% to 8,731.2 billion yen compared to March
31, 2012.
Net assets have increased by 18.1% to 4,074.0 billion yen compared to 3,450.0 billion yen as of
March 31, 2012. This was mainly due to Net income of 342.4 billion yen and a decrease in Translation
adjustments by 341.0 billion yen.
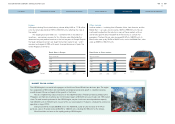
Free cash flow and net cash (auto business)
For fiscal year 2012, Nissan achieved a positive free cash flow of 248.6 billion yen. At the end of
fiscal year 2012, our net automotive cash improved significantly from last year to 915.9 billion yen.
We continue to maintain a close focus on our inventory of new vehicles. Inventory stood at
830,000 units at the end of fiscal 2012. The company continues to manage inventory carefully, in
order to limit its impact on free cash flow.
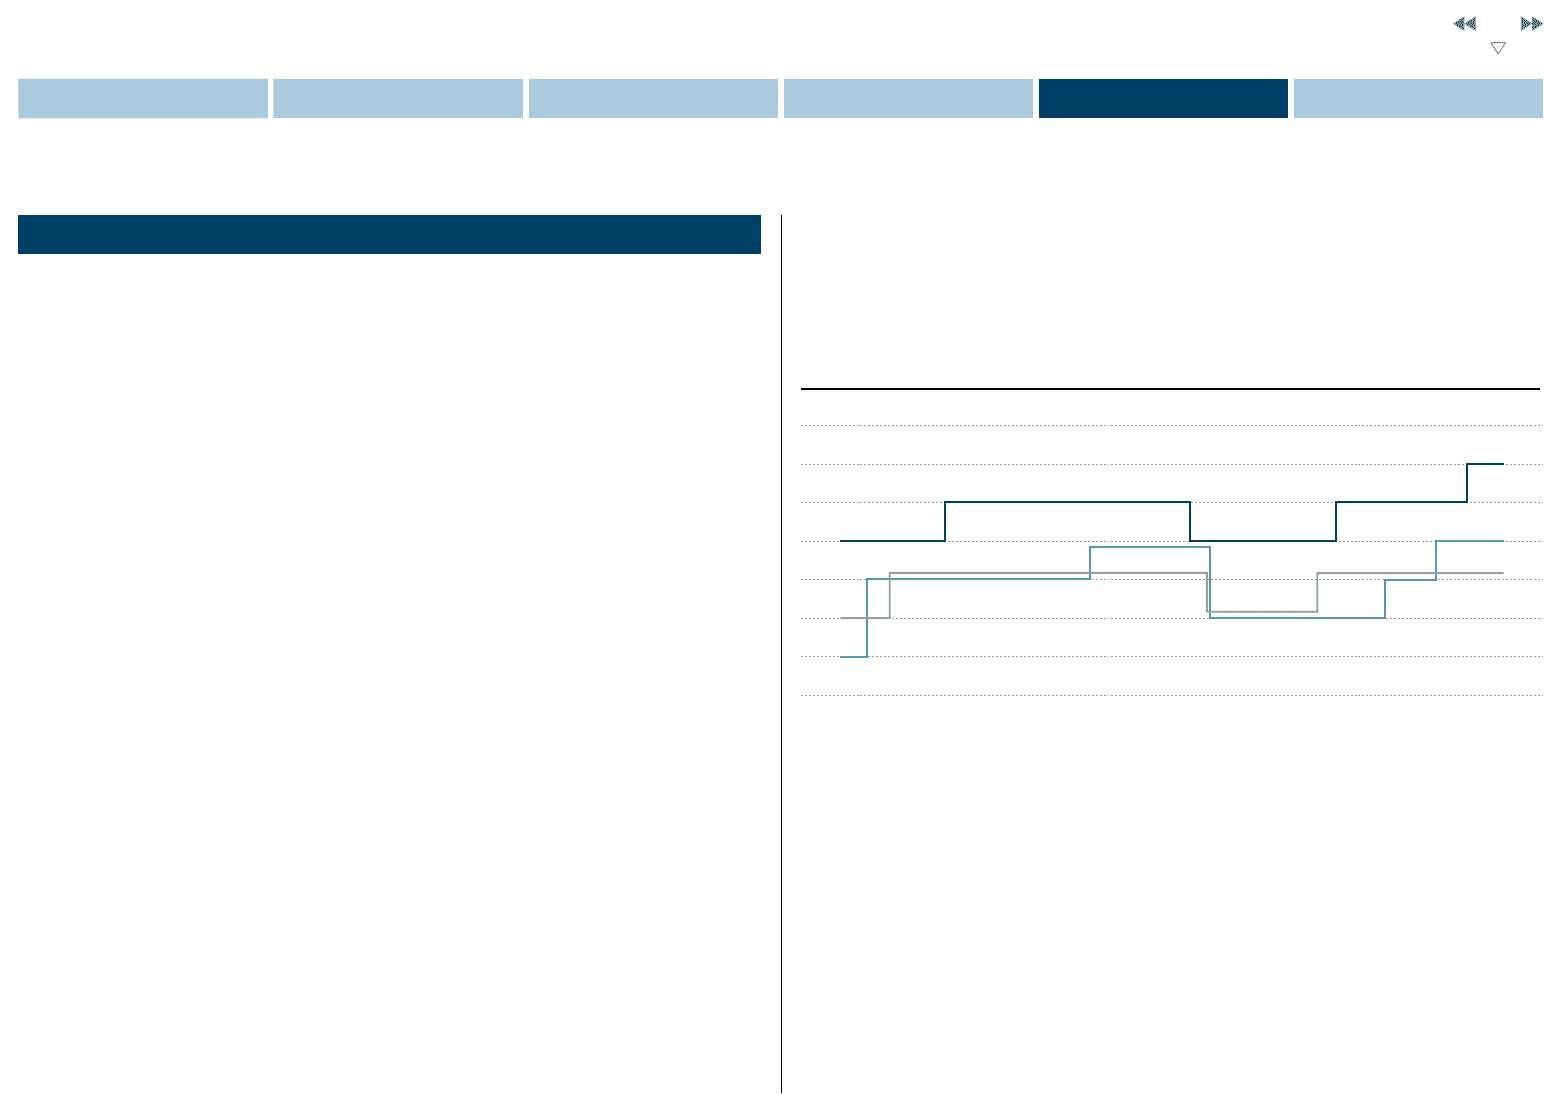
Aa3 AA–
A1 A+
A2 A
A3 A–
Baa1 BBB+
Baa2 BBB
Baa3 BBB–
Ba1 BB+
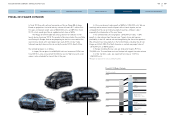
FINANCIAL POSITION
Corporate Ratings
Long-term credit rating
Nissan’s long-term credit rating with R&I is A+ with a stable outlook. S&P’s long-term credit rating for
Nissan is BBB+ with a stable outlook. Nissan’s credit rating with Moody’s is A3 with a stable outlook.
10/03 4/04 10/04 4/05 10/05
R&I
S&P
Moody’s
4/06 10/06 4/07 10/07 4/08 10/08 4/09 10/09 4/10 10/10 4/11 7/11 7/12 1/13
24
NISSAN MOTOR COMPANY ANNUAL REPORT 2013
PERFORMANCE
NISSAN POWER 88
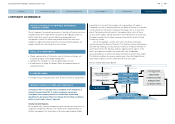
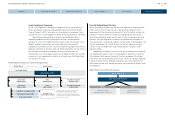
CORPORATE GOVERNANCE
CONTENTS
MANAGEMENT MESSAGES
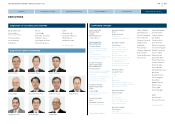
CORPORATE FACE TIME
NISSAN POWER 88