NetFlix 2014 Annual Report Download - page 71
Download and view the complete annual report
Please find page 71 of the 2014 NetFlix annual report below. You can navigate through the pages in the report by either clicking on the pages listed below, or by using the keyword search tool below to find specific information within the annual report.-
 1
1 -
2
-
3
-
4
-
5
-
6
-
7
-
8
-
9
-
10
-
11
-
12
-
13
-
14
-
15
-
16
-
17
-
18
-
19
-
20
-
21
-
22
-
23
-
24
-
25
-
26
-
27
-
28
-
29
-
30
-
31
-
32
-
33
-
34
-
35
-
36
-
37
-
38
-
39
-
40
-
41
-
42
-
43
-
44
-
45
-
46
-
47
-
48
-
49
-
50
-
51
-
52
-
53
-
54
-
55
-
56
-
57
-
58
-
59
-
60
-
 61
61 -
 62
62 -
 63
63 -
 64
64 -
 65
65 -
 66
66 -
 67
67 -
 68
68 -
 69
69 -
 70
70 -
 71
71 -
 72
72 -
 73
73 -
 74
74 -
 75
75 -
 76
76 -
 77
77 -
 78
78 -
 79
79 -
 80
80 -
 81
81 -
82
 |
 |

Table of Contents
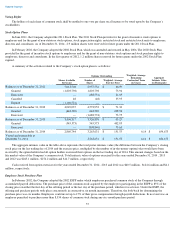
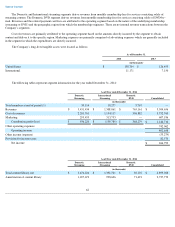
The following tables represent segment information for the year ended December 31, 2013:
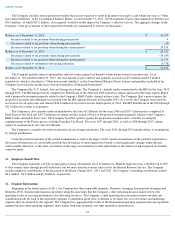
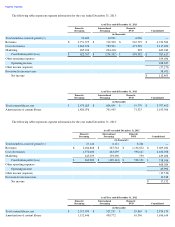
The following tables represent segment information for the year ended December 31, 2012:
As of/Year ended December 31, 2013
Domestic
Streaming
International
Streaming
Domestic
DVD
Consolidated
(in thousands)
Total members at end of period (1)
33,420
10,930
6,930
—
Revenues
$
2,751,375
$
712,390
$
910,797
$
4,374,562
Cost of revenues
1,863,376
782,304
471,523
3,117,203
Marketing
265,232
204,418
292
469,942
Contribution profit (loss)
$
622,767
$
(274,332
)
$
438,982
$
787,417
Other operating expenses
559,070
Operating income
228,347
Other income (expense)
(57,273
)
Provision for income taxes
58,671
Net income
$
112,403
As of/Year ended December 31, 2013
Domestic
Streaming
International
Streaming
Domestic
DVD
Consolidated
(in thousands)
Total content library, net
$
2,973,023
$
804,690
$
19,779
$
3,797,492
Amortization of content library
1,420,076
701,905
71,325
2,193,306
As of/Year ended December 31, 2012
Domestic
Streaming
International
Streaming
Domestic
DVD
Consolidated
(in thousands)
Total members at end of period (1)
27,146
6,121
8,224
—
Revenues
$
2,184,868
$
287,542
$
1,136,872
$
3,609,282
Cost of revenues
1,570,600
483,295
598,163
2,652,058
Marketing
245,259
193,390
559
439,208
Contribution profit (loss)
$
369,009
$
(389,143
)
$
538,150
$
518,016
Other operating expenses
468,024
Operating income
49,992
Other income (expense)
(19,512
)
Provision for income taxes
13,328
Net income
$
17,152
As of/Year ended December 31, 2012
Domestic
Streaming
International
Streaming
Domestic
DVD
Consolidated
(in thousands)
Total content library, net
$
2,317,070
$
527,235
$
29,865
$
2,874,170
Amortization of content library
1,152,446
438,772
65,396
1,656,614