NetFlix 2014 Annual Report Download - page 23
Download and view the complete annual report
Please find page 23 of the 2014 NetFlix annual report below. You can navigate through the pages in the report by either clicking on the pages listed below, or by using the keyword search tool below to find specific information within the annual report.-
 1
1 -
2
-
3
-
4
-
5
-
6
-
7
-
8
-
9
-
10
-
11
-
12
-
 13
13 -
 14
14 -
 15
15 -
 16
16 -
 17
17 -
 18
18 -
 19
19 -
 20
20 -
 21
21 -
 22
22 -
 23
23 -
 24
24 -
 25
25 -
 26
26 -
 27
27 -
 28
28 -
 29
29 -
 30
30 -
 31
31 -
 32
32 -
 33
33 -
34
-
35
-
36
-
37
-
38
-
39
-
40
-
41
-
42
-
43
-
44
-
45
-
46
-
47
-
48
-
49
-
50
-
51
-
52
-
53
-
54
-
55
-
56
-
57
-
58
-
59
-
60
-
61
-
62
-
63
-
64
-
65
-
66
-
67
-
68
-
69
-
70
-
71
-
72
-
73
-
74
-
75
-
76
-
77
-
78
-
79
-
80
-
81
-
82
 |
 |

Table of Contents
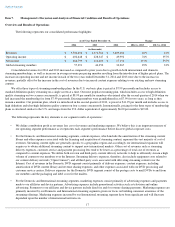
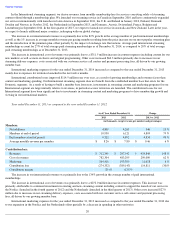
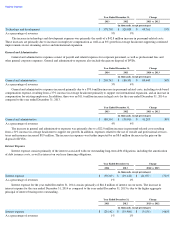
Year ended December 31, 2013 as compared to the year ended December 31, 2012
The increase in our domestic streaming revenues was due to the 26% growth in the average number of paid memberships. New member
additions and revenue related to $11.99 membership plans that were introduced in the second quarter of 2013 were not material for the year
ended December 31, 2013.
The increase in domestic streaming cost of revenues was primarily due to the $226.3 million increase in content expenses resulting from
continued investments in existing and new streaming content including more exclusive and original programming. In addition, streaming
delivery expenses increased by $31.7 million and other costs, such as payment processing fees and customer service call centers, increased
$34.8 million due to our growing member base.
Marketing expenses increased primarily due to an increase in advertising partially offset by a decrease in payments to affiliates in the U.S.
Our Domestic streaming segment had a contribution margin of 23% for the year ended December 31, 2013, which increased as compared
to the contribution margin of 17% for the year ended December 31, 2012, as a result of growing memberships and revenue faster than content
and marketing spending.
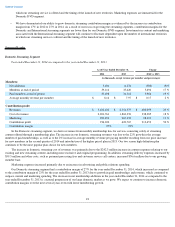
International Streaming Segment
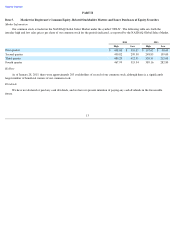
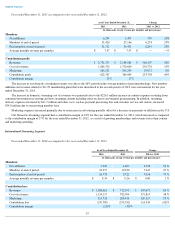
Year ended December 31, 2014 as compared to the year ended December 31, 2013
19
As of/ Year Ended December 31,
Change
2013
2012
2013 vs. 2012
(in thousands, except revenue per member and percentages)
Members:
Net additions
6,274
5,475
799
15
%
Members at end of period
33,420
27,146
6,274
23
%
Paid members at end of period
31,712
25,471
6,241
25
%
Average monthly revenue per member
$
7.97
$
7.97
$
—
—
%
Contribution profit:
Revenues
$
2,751,375
$
2,184,868
$
566,507
26
%
Cost of revenues
1,863,376
1,570,600
292,776
19
%
Marketing
265,232
245,259
19,973
8
%
Contribution profit
622,767
369,009
253,758
69
%
Contribution margin
23
%
17
%
As of/ Year Ended December 31,
Change
2014
2013
2014 vs. 2013
(in thousands, except revenue per member and percentages)
Members:
Net additions
7,347
4,809
2,538
53
%
Members at end of period
18,277
10,930
7,347
67
%
Paid members at end of period
16,778
9,722
7,056
73
%
Average monthly revenue per member
$
8.34
$
8.26
$
0.08
1
%
Contribution loss:
Revenues
$
1,308,061
$
712,390
$
595,671
84
%
Cost of revenues
1,154,117
782,304
371,813
48
%
Marketing
313,733
204,418
109,315
53
%
Contribution loss
(159,789
)
(274,332
)
114,543
(42
)%
Contribution margin
(12
)%
(39
)%