NetFlix 2014 Annual Report Download - page 56
Download and view the complete annual report
Please find page 56 of the 2014 NetFlix annual report below. You can navigate through the pages in the report by either clicking on the pages listed below, or by using the keyword search tool below to find specific information within the annual report.-
 1
1 -
2
-
3
-
4
-
5
-
6
-
7
-
8
-
9
-
10
-
11
-
12
-
13
-
14
-
15
-
16
-
17
-
18
-
19
-
20
-
21
-
22
-
23
-
24
-
25
-
26
-
27
-
28
-
29
-
30
-
31
-
32
-
33
-
34
-
35
-
36
-
37
-
38
-
39
-
40
-
41
-
42
-
43
-
44
-
45
-
 46
46 -
 47
47 -
 48
48 -
 49
49 -
 50
50 -
 51
51 -
 52
52 -
 53
53 -
 54
54 -
 55
55 -
 56
56 -
 57
57 -
 58
58 -
 59
59 -
 60
60 -
 61
61 -
 62
62 -
 63
63 -
 64
64 -
 65
65 -
 66
66 -
67
-
68
-
69
-
70
-
71
-
72
-
73
-
74
-
75
-
76
-
77
-
78
-
79
-
80
-
81
-
82
 |
 |
Table of Contents
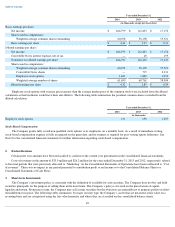
(1) Primarily restricted cash that is related to workers compensation deposits.
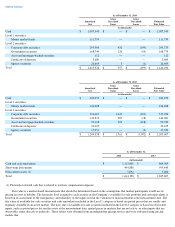
Fair value is a market-based measurement that should be determined based on the assumptions that market participants would use in
pricing an asset or liability. The hierarchy level assigned to each security in the Company’s available-for-sale portfolio and cash equivalents is
based on its assessment of the transparency and reliability of the inputs used in the valuation of such instrument at the measurement date. The
fair value of available-for-sale securities and cash equivalents included in the Level 1 category is based on quoted prices that are readily and
regularly available in an active market. The fair value of available-for-sale securities included in the Level 2 category is based on observable
inputs, such as quoted prices for similar assets at the measurement date; quoted prices in markets that are not active; or other inputs that are
observable, either directly or indirectly. These values were obtained from an independent pricing service and were evaluated using pricing
models that
As of December 31, 2014
Amortized
Cost
Gross
Unrealized
Gains
Gross
Unrealized
Losses
Estimated
Fair Value
(in thousands)
Cash
$
1,007,543
$
—
$
—
$
1,007,543
Level 1 securities:
Money market funds
111,759
—
—
111,759
Level 2 securities:
Corporate debt securities
295,500
432
(199
)
295,733
Government securities
168,749
120
(95
)
168,774
Asset and mortgage-backed securities
112
—
—
112
Certificate of deposits
3,600
—
—
3,600
Agency securities
26,665
5
(1
)
26,669
Total
$
1,613,928
$
557
$
(295
)
$
1,614,190
As of December 31, 2013
Amortized
Cost
Gross
Unrealized
Gains
Gross
Unrealized
Losses
Estimated
Fair Value
(in thousands)
Cash
$
483,959
$
—
$
—
$
483,959
Level 1 securities:
Money market funds
126,208
—
—
126,208
Level 2 securities:
Corporate debt securities
316,465
1,245
(654
)
317,056
Government securities
143,812
287
(18
)
144,081
Asset and mortgage-backed securities
93,118
229
(418
)
92,929
Certificate of deposits
23,425
—
—
23,425
Agency securities
17,951
—
(
2
)
17,949
Total
$
1,204,938
$
1,761
$
(1,092
)
$
1,205,607
As of December 31,
2014
2013
(in thousands)
Cash and cash equivalents
$
1,113,608
$
604,965
Short-term investments
494,888
595,440
Non-current assets (1)
5,694
5,202
Total
$
1,614,190
$
1,205,607