NetFlix 2014 Annual Report Download - page 24
Download and view the complete annual report
Please find page 24 of the 2014 NetFlix annual report below. You can navigate through the pages in the report by either clicking on the pages listed below, or by using the keyword search tool below to find specific information within the annual report.-
 1
1 -
2
-
3
-
4
-
5
-
6
-
7
-
8
-
9
-
10
-
11
-
12
-
13
-
 14
14 -
 15
15 -
 16
16 -
 17
17 -
 18
18 -
 19
19 -
 20
20 -
 21
21 -
 22
22 -
 23
23 -
 24
24 -
 25
25 -
 26
26 -
 27
27 -
 28
28 -
 29
29 -
 30
30 -
 31
31 -
 32
32 -
 33
33 -
 34
34 -
35
-
36
-
37
-
38
-
39
-
40
-
41
-
42
-
43
-
44
-
45
-
46
-
47
-
48
-
49
-
50
-
51
-
52
-
53
-
54
-
55
-
56
-
57
-
58
-
59
-
60
-
61
-
62
-
63
-
64
-
65
-
66
-
67
-
68
-
69
-
70
-
71
-
72
-
73
-
74
-
75
-
76
-
77
-
78
-
79
-
80
-
81
-
82
 |
 |

Table of Contents
In the International streaming segment, we derive revenues from monthly membership fees for services consisting solely of streaming
content offered through a membership plan. We launched our streaming service in Canada in September 2010 and have continuously expanded
our services internationally with launches in Latin America in September 2011, the U.K. and Ireland in January 2012, Finland, Denmark,
Sweden and Norway in October 2012, the Netherlands in September 2013, and Germany, Austria, Switzerland, France, Belgium and
Luxembourg in September 2014. In the first quarter of 2015, we expect to launch our service in Australia and New Zealand. Later in the year,
we expect to launch additional major countries, in keeping with our global strategy.
The increase in our international revenues was primarily due to the 82% growth in the average number of paid international memberships
as well as the 1% increase in average monthly revenue per paying member resulting from the price increase on our most popular streaming plan
and the introduction of the premium plan, offset partially by the impact of exchange rate fluctuations. Average paid international streaming
memberships account for 27% of total average paid streaming memberships as of December 31, 2014, as compared to 20% of total average
paid streaming memberships as of December 31, 2013.
The increase
in international cost of revenues was primarily due to a $311.5 million increase in content expenses including content for our
new markets as well as more exclusive and original programming. Other costs increased $60.3 million primarily due to increases in our
streaming delivery expenses, costs associated with our customer service call centers and payment processing fees, all driven by our growing
member base.
International marketing expenses for the year ended December 31, 2014 increased as compared to the year ended December 31, 2013
mainly due to expenses for territories launched in the last twelve months.
International contribution losses improved $114.5 million year over year, as a result of growing memberships and revenues faster than
content and marketing spending. Our International streaming segment does not benefit from the established member base that exists for the
Domestic segments. As a result of having to build a member base from zero, investments in streaming content and marketing programs for our
International segment are larger initially relative to revenues, in particular as new territories are launched. The contribution losses for our
International segment have been significant due to investments in streaming content and marketing programs to drive membership growth and
viewing in our international markets.
Year ended December 31, 2013 as compared to the year ended December 31, 2012
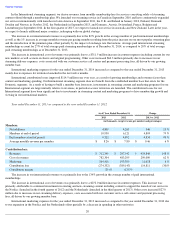
The increase in our international revenues was primarily due to the 134% growth in the average number of paid international
memberships.
The increase in international cost of revenues was primarily due to a $272.0 million increase in content expenses. This increase was
primarily attributable to continued investments in existing and new streaming content including content to support the launch of our service in
the Nordics (launched in the fourth quarter of 2012) and the Netherlands (launched in the third quarter of 2013). Other costs increased $27.0
million due to increases in our streaming delivery expenses, costs associated with our customer service call centers and payment processing
fees, all driven by our growing member base.
International marketing expenses for the year ended December 31, 2013 increased as compared to the year ended December 31, 2012 due
to our expansion in the Nordics and the Netherlands offset partially by a decrease in spending in other territories.
20
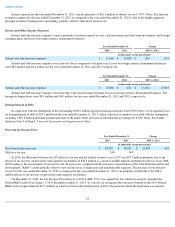
As of/ Year Ended December 31,
Change
2013
2012
2013 vs. 2012
(in thousands, except revenue per member and percentages)
Members:
Net additions
4,809
4,263
546
13
%
Members at end of period
10,930
6,121
4,809
79
%
Paid members at end of period
9,722
4,892
4,830
99
%
Average monthly revenue per member
$
8.26
$
7.80
$
0.46
6
%
Contribution loss:
Revenues
$
712,390
$
287,542
$
424,848
148
%
Cost of revenues
782,304
483,295
299,009
62
%
Marketing
204,418
193,390
11,028
6
%
Contribution loss
(274,332
)
(389,143
)
114,811
(30
)%
Contribution margin
(39
)%
(135
)%