NetFlix 2014 Annual Report Download - page 27
Download and view the complete annual report
Please find page 27 of the 2014 NetFlix annual report below. You can navigate through the pages in the report by either clicking on the pages listed below, or by using the keyword search tool below to find specific information within the annual report.-
 1
1 -
2
-
3
-
4
-
5
-
6
-
7
-
8
-
9
-
10
-
11
-
12
-
13
-
14
-
15
-
16
-
 17
17 -
 18
18 -
 19
19 -
 20
20 -
 21
21 -
 22
22 -
 23
23 -
 24
24 -
 25
25 -
 26
26 -
 27
27 -
 28
28 -
 29
29 -
 30
30 -
 31
31 -
 32
32 -
 33
33 -
 34
34 -
 35
35 -
 36
36 -
 37
37 -
38
-
39
-
40
-
41
-
42
-
43
-
44
-
45
-
46
-
47
-
48
-
49
-
50
-
51
-
52
-
53
-
54
-
55
-
56
-
57
-
58
-
59
-
60
-
61
-
62
-
63
-
64
-
65
-
66
-
67
-
68
-
69
-
70
-
71
-
72
-
73
-
74
-
75
-
76
-
77
-
78
-
79
-
80
-
81
-
82
 |
 |

Table of Contents
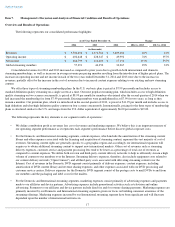
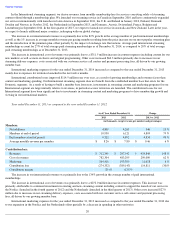
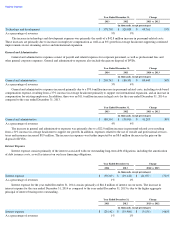
The increase in technology and development expenses was primarily the result of a $42.8 million increase in personnel-related costs.
These increases are primarily due to increases in employee compensation as well as an 8% growth in average headcount supporting continued
improvements in our streaming service and international expansion.
General and Administrative
General and administrative expenses consist of payroll and related expenses for corporate personnel, as well as professional fees and
other general corporate expenses. General and administrative expenses also include the gain on disposal of DVDs.
General and administrative expenses increased primarily due to a $70.6 million increase in personnel-related costs, including stock-based
compensation expense, resulting from a 37% increase in average headcount primarily to support our international expansion, and an increase in
compensation for existing employees. In addition, there was an $11.6 million increase in legal costs for the year ended December 31, 2014 as
compared to the year ended December 31, 2013.
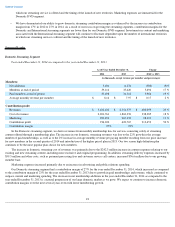
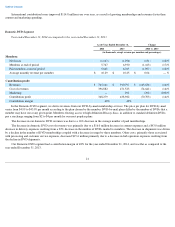
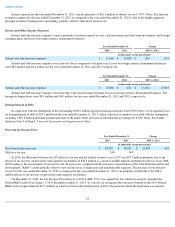
The increase in general and administrative expenses was primarily due to a $22.0 million increase in personnel-related costs resulting
from a 31% increase in average headcount to support our growth. In addition, expenses related to the use of outside and professional services,
taxes and insurance increased $8.9 million. The increase in expenses was further impacted by an $8.0 million decrease in the gain on the
disposal of DVDs.
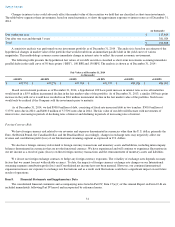
Interest Expense
Interest expense consists primarily of the interest associated with our outstanding long-term debt obligations, including the amortization
of debt issuance costs, as well as interest on our lease financing obligations.
Interest expense for the year ended December 31, 2014 consists primarily of $46.8 million of interest on our notes. The increase in
interest expense for the year ended December 31, 2014 as compared to the year ended December 31, 2013 is due to the higher aggregate
principal of interest bearing notes outstanding.
Year Ended December 31,
Change
2013
2012
2013 vs. 2012
(in thousands, except percentages)
Technology and development
$
378,769
$
329,008
$
49,761
15
%
As a percentage of revenues
9
%
9
%
Year Ended December 31,
Change
2014
2013
2014 vs. 2013
(in thousands, except percentages)
General and administrative
$
269,741
$
180,301
$
89,440
50
%
As a percentage of revenues
5
%
4
%
Year Ended December 31,
Change
2013
2012
2013 vs. 2012
(in thousands, except percentages)
General and administrative
$
180,301
$
139,016
$
41,285
30
%
As a percentage of revenues
4
%
4
%
Year Ended December 31,
Change
2014
2013
2014 vs. 2013
(in thousands, except percentages)
Interest expense
$
(50,219
)
$
(29,142
)
$
(21,077
)
(72
)%
As a percentage of revenues
1
%
1
%
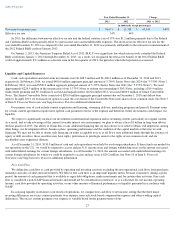
Year Ended December 31,
Change
2013
2012
2013 vs. 2012
(in thousands, except percentages)
Interest expense
$
(29,142
)
$
(19,986
)
$
(9,156
)
(46
)%
As a percentage of revenues
1
%
1
%