NetFlix 2014 Annual Report Download - page 48
Download and view the complete annual report
Please find page 48 of the 2014 NetFlix annual report below. You can navigate through the pages in the report by either clicking on the pages listed below, or by using the keyword search tool below to find specific information within the annual report.-
 1
1 -
2
-
3
-
4
-
5
-
6
-
7
-
8
-
9
-
10
-
11
-
12
-
13
-
14
-
15
-
16
-
17
-
18
-
19
-
20
-
21
-
22
-
23
-
24
-
25
-
26
-
27
-
28
-
29
-
30
-
31
-
32
-
33
-
34
-
35
-
36
-
37
-
 38
38 -
 39
39 -
 40
40 -
 41
41 -
 42
42 -
 43
43 -
 44
44 -
 45
45 -
 46
46 -
 47
47 -
 48
48 -
 49
49 -
 50
50 -
 51
51 -
 52
52 -
 53
53 -
 54
54 -
 55
55 -
 56
56 -
 57
57 -
 58
58 -
59
-
60
-
61
-
62
-
63
-
64
-
65
-
66
-
67
-
68
-
69
-
70
-
71
-
72
-
73
-
74
-
75
-
76
-
77
-
78
-
79
-
80
-
81
-
82
 |
 |
Table of Contents
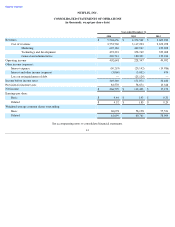
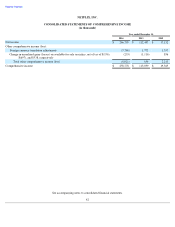
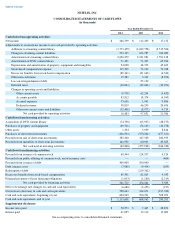
NETFLIX, INC.
CONSOLIDATED STATEMENTS OF CASH FLOWS
(in thousands)
See accompanying notes to consolidated financial statements.
Year Ended December 31,
2014
2013
2012
Cash flows from operating activities:
Net income
$
266,799
$
112,403
$
17,152
Adjustments to reconcile net income to net cash provided by operating activities:
Additions to streaming content library
(3,773,459
)
(3,049,758
)
(2,515,506
)
Change in streaming content liabilities
593,125
673,785
762,089
Amortization of streaming content library
2,656,279
2,121,981
1,591,218
Amortization of DVD content library
71,491
71,325
65,396
Depreciation and amortization of property, equipment and intangibles
54,028
48,374
45,469
Stock-based compensation expense
115,239
73,100
73,948
Excess tax benefits from stock-based compensation
(89,341
)
(81,663
)
(4,543
)
Other non-cash items
15,282
5,332
(8,392
)
Loss on extinguishment of debt
—
25,129
—
Deferred taxes
(30,063
)
(22,044
)
(30,071
)
Changes in operating assets and liabilities:
Other current assets
(8,758
)
62,234
(5,432
)
Accounts payable
83,812
18,374
(4,943
)
Accrued expenses
55,636
1,941
9,806
Deferred revenue
58,819
46,295
20,676
Other non-current assets and liabilities
(52,406
)
(8,977
)
4,719
Net cash provided by operating activities
16,483
97,831
21,586
Cash flows from investing activities:
Acquisition of DVD content library
(74,790
)
(65,927
)
(48,275
)
Purchases of property and equipment
(69,726
)
(54,143
)
(40,278
)
Other assets
1,334
5,939
8,816
Purchases of short-term investments
(426,934
)
(550,264
)
(477,321
)
Proceeds from sale of short-term investments
385,300
347,502
282,953
Proceeds from maturities of short-term investments
141,950
60,925
29,365
Net cash used in investing activities
(42,866
)
(255,968
)
(244,740
)
Cash flows from financing activities:
Proceeds from issuance of common stock
60,544
124,557
4,124
Proceeds from public offering of common stock, net of issuance costs
—
—
(
464
)
Proceeds from issuance of debt
400,000
500,000
—
Debt issuance costs
(7,080
)
(9,414
)
(295
)
Redemption of debt
—
(
219,362
)
—
Excess tax benefits from stock-based compensation
89,341
81,663
4,543
Principal payments of lease financing obligations
(1,093
)
(1,180
)
(2,319
)
Net cash provided by financing activities
541,712
476,264
5,589
Effect of exchange rate changes on cash and cash equivalents
(6,686
)
(3,453
)
(197
)
Net increase (decrease) in cash and cash equivalents
508,643
314,674
(217,762
)
Cash and cash equivalents, beginning of year
604,965
290,291
508,053
Cash and cash equivalents, end of year
$
1,113,608
$
604,965
$
290,291
Supplemental disclosure:
Income taxes paid
$
50,573
$
7,465
$
28,853
Interest paid
41,085
19,114
19,009