NetFlix 2014 Annual Report Download - page 70
Download and view the complete annual report
Please find page 70 of the 2014 NetFlix annual report below. You can navigate through the pages in the report by either clicking on the pages listed below, or by using the keyword search tool below to find specific information within the annual report.-
 1
1 -
2
-
3
-
4
-
5
-
6
-
7
-
8
-
9
-
10
-
11
-
12
-
13
-
14
-
15
-
16
-
17
-
18
-
19
-
20
-
21
-
22
-
23
-
24
-
25
-
26
-
27
-
28
-
29
-
30
-
31
-
32
-
33
-
34
-
35
-
36
-
37
-
38
-
39
-
40
-
41
-
42
-
43
-
44
-
45
-
46
-
47
-
48
-
49
-
50
-
51
-
52
-
53
-
54
-
55
-
56
-
57
-
58
-
59
-
 60
60 -
 61
61 -
 62
62 -
 63
63 -
 64
64 -
 65
65 -
 66
66 -
 67
67 -
 68
68 -
 69
69 -
 70
70 -
 71
71 -
 72
72 -
 73
73 -
 74
74 -
 75
75 -
 76
76 -
 77
77 -
 78
78 -
 79
79 -
 80
80 -
81
-
82
 |
 |

Table of Contents
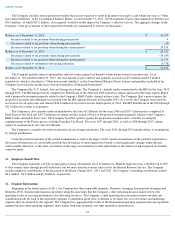
The Domestic and International streaming segments derive revenues from monthly membership fees for services consisting solely of
streaming content. The Domestic DVD segment derives revenues from monthly membership fees for services consisting solely of DVD-by-
mail. Revenues and the related payment card fees are attributed to the operating segment based on the nature of the underlying membership
(streaming or DVD) and the geographic region from which the membership originates. There are no internal revenue transactions between the
Company’s segments.
Cost of revenues are primarily attributed to the operating segment based on the amounts directly incurred by the segment to obtain
content and deliver it to the specific region. Marketing expenses are primarily comprised of advertising expenses which are generally included
in the segment in which the expenditures are directly incurred.
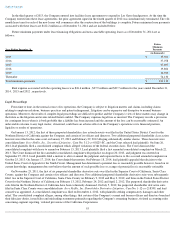
The Company's long-lived tangible assets were located as follows:
The following tables represent segment information for the year ended December 31, 2014:
62
As of December 31,
2014
2013
(in thousands)
United States
$
138,704
$
126,455
International
11,171
7,150
As of/Year ended December 31, 2014
Domestic
Streaming
International
Streaming
Domestic
DVD
Consolidated
(in thousands)
Total members at end of period (1)
39,114
18,277
5,767
—
Revenues
$
3,431,434
$
1,308,061
$
765,161
$
5,504,656
Cost of revenues
2,201,761
1,154,117
396,882
3,752,760
Marketing
293,453
313,733
—
607,186
Contribution profit (loss)
$
936,220
$
(159,789
)
$
368,279
$
1,144,710
Other operating expenses
742,062
Operating income
402,648
Other income (expense)
(53,279
)
Provision for income taxes
82,570
Net income
$
266,799
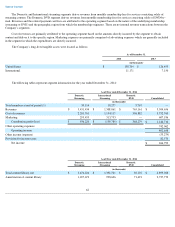
As of/Year ended December 31, 2014
Domestic
Streaming
International
Streaming
Domestic
DVD
Consolidated
(in thousands)
Total content library, net
$
3,476,226
$
1,392,701
$
30,101
$
4,899,028
Amortization of content library
1,657,673
998,606
71,491
2,727,770