NetFlix 2014 Annual Report Download - page 18
Download and view the complete annual report
Please find page 18 of the 2014 NetFlix annual report below. You can navigate through the pages in the report by either clicking on the pages listed below, or by using the keyword search tool below to find specific information within the annual report.-
 1
1 -
2
-
3
-
4
-
5
-
6
-
7
-
 8
8 -
 9
9 -
 10
10 -
 11
11 -
 12
12 -
 13
13 -
 14
14 -
 15
15 -
 16
16 -
 17
17 -
 18
18 -
 19
19 -
 20
20 -
 21
21 -
 22
22 -
 23
23 -
 24
24 -
 25
25 -
 26
26 -
 27
27 -
 28
28 -
29
-
30
-
31
-
32
-
33
-
34
-
35
-
36
-
37
-
38
-
39
-
40
-
41
-
42
-
43
-
44
-
45
-
46
-
47
-
48
-
49
-
50
-
51
-
52
-
53
-
54
-
55
-
56
-
57
-
58
-
59
-
60
-
61
-
62
-
63
-
64
-
65
-
66
-
67
-
68
-
69
-
70
-
71
-
72
-
73
-
74
-
75
-
76
-
77
-
78
-
79
-
80
-
81
-
82
 |
 |
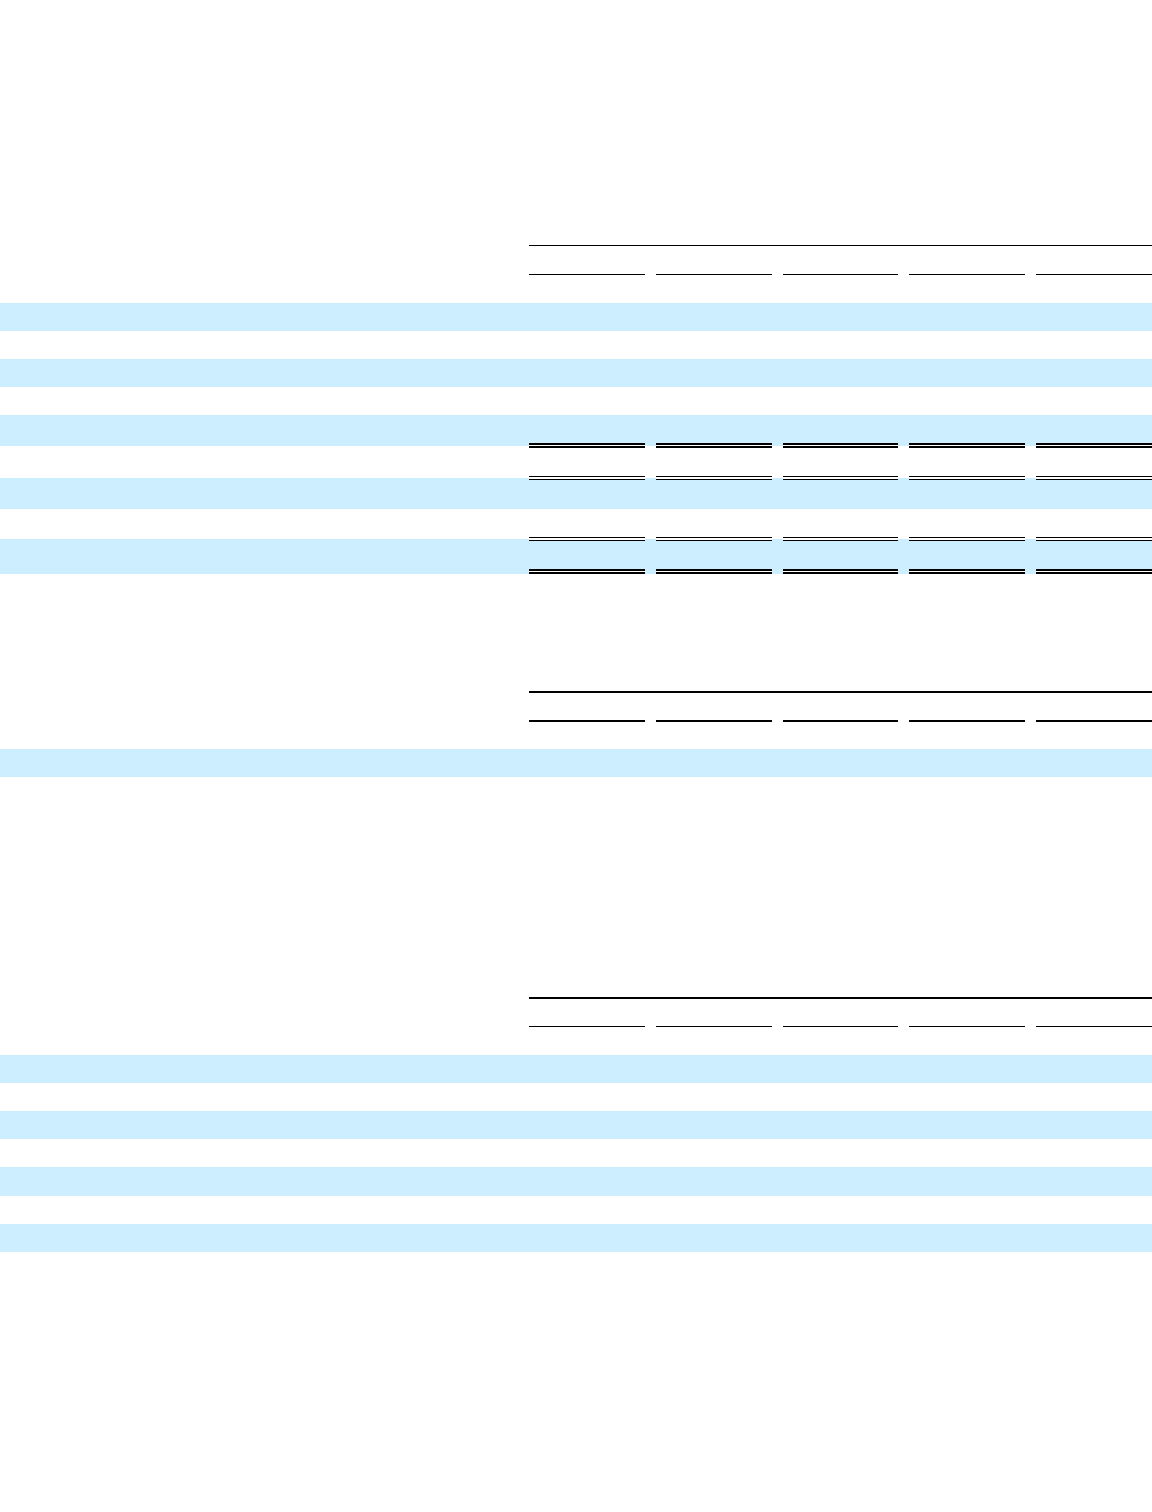
Table of Contents
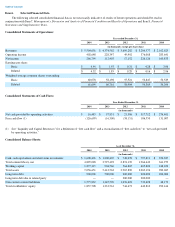
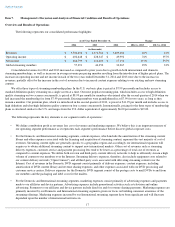
The following selected consolidated financial data is not necessarily indicative of results of future operations and should be read in
conjunction with Item 7, Management’s Discussion and Analysis of Financial Condition and Results of Operations and Item 8, Financial
Statements and Supplementary Data .
Consolidated Statements of Operations:
Consolidated Statements of Cash Flows:
Consolidated Balance Sheets:
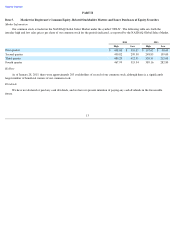
Item 6.
Selected Financial Data
Year ended December 31,
2014
2013
2012
2011
2010
(in thousands, except per share data)
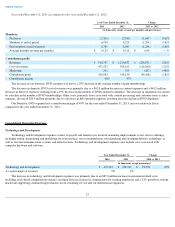
Revenues
$
5,504,656
$
4,374,562
$
3,609,282
$
3,204,577
$
2,162,625
Operating income
402,648
228,347
49,992
376,068
283,641
Net income
266,799
112,403
17,152
226,126
160,853
Earnings per share:
Basic
$
4.44
$
1.93
$
0.31
$
4.28
$
3.06
Diluted
$
4.32
$
1.85
$
0.29
$
4.16
$
2.96
Weighted-average common shares outstanding:
Basic
60,078
58,198
55,521
52,847
52,529
Diluted
61,699
60,761
58,904
54,369
54,304
Year Ended December 31,
2014
2013
2012
2011
2010
(in thousands)
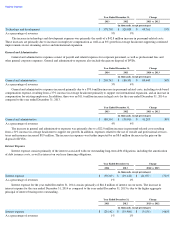
Net cash provided by operating activities
$
16,483
$
97,831
$
21,586
$
317,712
$
276,401
Free cash flow (1)
(126,699
)
(16,300
)
(58,151
)
186,550
131,007
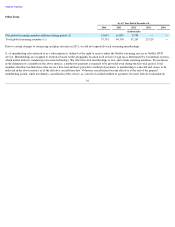
(1) See “Liquidity and Capital Resources” for a definition of “free cash flow” and a reconciliation of “free cash flow” to “net cash provided
by operating activities.”
As of December 31,
2014
2013
2012
2011
2010
(in thousands)
Cash, cash equivalents and short-term investments
$
1,608,496
$
1,200,405
$
748,078
$
797,811
$
350,387
Total content library, net
4,899,028
3,797,492
2,874,170
1,966,643
361,979
Working capital
1,277,315
904,560
564,865
605,802
248,652
Total assets
7,056,651
5,412,563
3,967,890
3,069,196
982,067
Long-term debt
900,000
500,000
200,000
200,000
200,000
Long-term debt due to related party
—
—
200,000
200,000
—
Non-current content liabilities
1,575,832
1,345,590
1,076,622
739,628
48,179
Total stockholders’ equity
1,857,708
1,333,561
744,673
642,810
290,164