NetFlix 2014 Annual Report Download - page 31
Download and view the complete annual report
Please find page 31 of the 2014 NetFlix annual report below. You can navigate through the pages in the report by either clicking on the pages listed below, or by using the keyword search tool below to find specific information within the annual report.-
 1
1 -
2
-
3
-
4
-
5
-
6
-
7
-
8
-
9
-
10
-
11
-
12
-
13
-
14
-
15
-
16
-
17
-
18
-
19
-
20
-
 21
21 -
 22
22 -
 23
23 -
 24
24 -
 25
25 -
 26
26 -
 27
27 -
 28
28 -
 29
29 -
 30
30 -
 31
31 -
 32
32 -
 33
33 -
 34
34 -
 35
35 -
 36
36 -
 37
37 -
 38
38 -
 39
39 -
 40
40 -
 41
41 -
42
-
43
-
44
-
45
-
46
-
47
-
48
-
49
-
50
-
51
-
52
-
53
-
54
-
55
-
56
-
57
-
58
-
59
-
60
-
61
-
62
-
63
-
64
-
65
-
66
-
67
-
68
-
69
-
70
-
71
-
72
-
73
-
74
-
75
-
76
-
77
-
78
-
79
-
80
-
81
-
82
 |
 |

Table of Contents
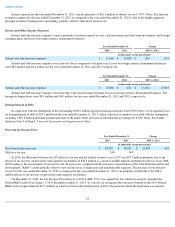
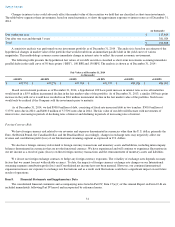
content agreements and is expected to continue to be significant as we enter into more agreements with upfront cash payments, such as original
content agreements. Working capital differences include deferred revenue, taxes and semi-annual interest payments on our outstanding debt.
Our receivables from members generally settle quickly and deferred revenue is a source of cash flow.
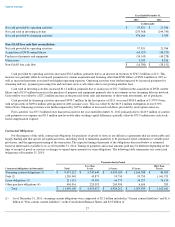
Cash provided by operating activities decreased $81.3 million, primarily due to increased payments for content other than DVD library of
$835.1 million or 32%, as well as increased payments associated with higher operating expenses. The increased use of cash was partially offset
by a $1,130.1 million or 26% increase in revenues.
Cash used in investing activities decreased $213.1 million, primarily due to a decrease of $242.2 million in the purchases of short-term
investments, net of proceeds from sales and maturities. This decrease was offset by an increase of $15.6 million purchases of property and
equipment.
Cash provided by financing activities increased $65.4 million primarily due to the $392.9 million net proceeds from the issuance of the
5.750% Notes in the year ended December 31, 2014 as compared to the $490.6 million net proceeds from the issuance of the 5.375% Notes less
the $219.4 million redemption of our 8.50% Notes in the year ended December 31, 2013. This increase was partially offset by a decrease of
$56.3 million from the issuance of common stock, including the impact of excess tax benefits.
Free cash flow was $393.5 million lower than net income for the year ended December 31, 2014 primarily due to $534.2 million of
content cash payments over expense partially offset by $115.2 million of non-cash stock-based compensation expense and $25.5 million of
favorable other working capital differences.
Free cash flow was $128.7 million lower than net income for the year ended December 31, 2013 primarily due to $227.9 million of
content cash payments over expense and $45.3 million non-favorable other working capital differences. This was partially offset by $73.1
million non-cash stock-
based compensation expense, $46.3 million in deferred revenue and $25.1 million loss on debt extinguishment, the cash
impact of which is a financing activity and therefore not included in free cash flow.
26
Year Ended December 31,
2014
2013
(in thousands)
Net cash provided by operating activities
$
16,483
$
97,831
Net cash used in investing activities
(42,866
)
(255,968
)
Net cash provided by financing activities
541,712
476,264
Non-GAAP free cash flow reconciliation:
Net cash provided by operating activities
16,483
97,831
Acquisition of DVD content library
(74,790
)
(65,927
)
Purchases of property and equipment
(69,726
)
(54,143
)
Other assets
1,334
5,939
Non-GAAP free cash flow
$
(126,699
)
$
(16,300
)