NetFlix 2014 Annual Report Download - page 26
Download and view the complete annual report
Please find page 26 of the 2014 NetFlix annual report below. You can navigate through the pages in the report by either clicking on the pages listed below, or by using the keyword search tool below to find specific information within the annual report.-
 1
1 -
2
-
3
-
4
-
5
-
6
-
7
-
8
-
9
-
10
-
11
-
12
-
13
-
14
-
15
-
 16
16 -
 17
17 -
 18
18 -
 19
19 -
 20
20 -
 21
21 -
 22
22 -
 23
23 -
 24
24 -
 25
25 -
 26
26 -
 27
27 -
 28
28 -
 29
29 -
 30
30 -
 31
31 -
 32
32 -
 33
33 -
 34
34 -
 35
35 -
 36
36 -
37
-
38
-
39
-
40
-
41
-
42
-
43
-
44
-
45
-
46
-
47
-
48
-
49
-
50
-
51
-
52
-
53
-
54
-
55
-
56
-
57
-
58
-
59
-
60
-
61
-
62
-
63
-
64
-
65
-
66
-
67
-
68
-
69
-
70
-
71
-
72
-
73
-
74
-
75
-
76
-
77
-
78
-
79
-
80
-
81
-
82
 |
 |

Table of Contents
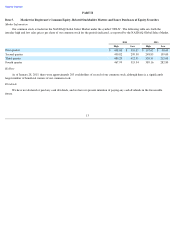
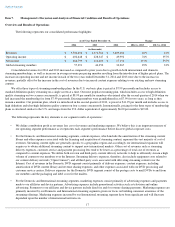
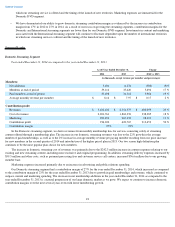
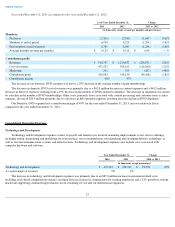
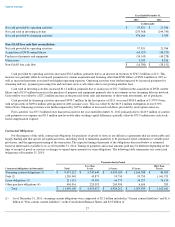
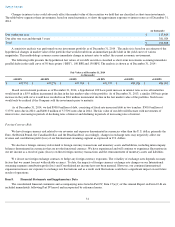
Year ended December 31, 2013 as compared to the year ended December 31, 2012
The decrease in our domestic DVD revenues was due to a 20% decrease in the average number of paid memberships.
The decrease in domestic DVD cost of revenues was primarily due to a $62.0 million decrease in content expenses and a $44.2 million
decrease in delivery expenses resulting from a 19% decrease in the number of DVDs mailed to members. The decrease in shipments was driven
by a decline in the number of DVD memberships. Other costs, primarily those associated with content processing and customer service center
expenses, decreased $20.4 million primarily due to a decrease in hub operation expenses resulting from the decline in DVD shipments.
Our Domestic DVD segment had a contribution margin of 48% for the year ended December 31, 2013, and was relatively flat as
compared to the year ended December 31, 2012.
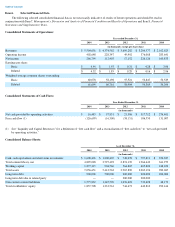
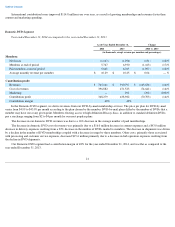
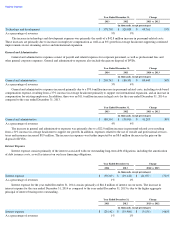
Consolidated Operating Expenses
Technology and Development
Technology and development expenses consist of payroll and related costs incurred in making improvements to our service offerings,
including testing, maintaining and modifying our user interface, our recommendation, merchandising and streaming delivery technology, as
well as our telecommunications systems and infrastructures. Technology and development expenses also include costs associated with
computer hardware and software.
The increase in technology and development expenses was primarily due to an $87.4 million increase in personnel-related costs,
including stock-based compensation expense, resulting from an increase in compensation for existing employees and a 12% growth in average
headcount supporting continued improvements in our streaming service and our international expansion.
22
As of/ Year Ended December 31,
Change
2013
2012
2013 vs. 2012
(in thousands, except revenue per member and percentages)
Members:
Net losses
(1,294
)
(2,941
)
(1,647
)
(56
)%
Members at end of period
6,930
8,224
(1,294
)
(16
)%
Paid members at end of period
6,765
8,049
(1,284
)
(16
)%
Average monthly revenue per member
$
10.25
$
10.21
$
0.04
—
%
Contribution profit:
Revenues
$
910,797
$
1,136,872
$
(226,075
)
(20
)%
Cost of revenues
471,523
598,163
(126,640
)
(21
)%
Marketing
292
559
(267
)
(48
)%
Contribution profit
438,982
538,150
(99,168
)
(18
)%
Contribution margin
48
%
47
%
Year Ended December 31,
Change
2014
2013
2014 vs. 2013
(in thousands, except percentages)
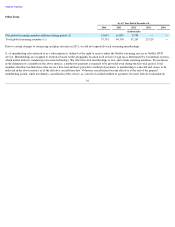
Technology and development
$
472,321
$
378,769
$
93,552
25
%
As a percentage of revenues
9
%
9
%