NetFlix 2014 Annual Report Download - page 55
Download and view the complete annual report
Please find page 55 of the 2014 NetFlix annual report below. You can navigate through the pages in the report by either clicking on the pages listed below, or by using the keyword search tool below to find specific information within the annual report.-
 1
1 -
2
-
3
-
4
-
5
-
6
-
7
-
8
-
9
-
10
-
11
-
12
-
13
-
14
-
15
-
16
-
17
-
18
-
19
-
20
-
21
-
22
-
23
-
24
-
25
-
26
-
27
-
28
-
29
-
30
-
31
-
32
-
33
-
34
-
35
-
36
-
37
-
38
-
39
-
40
-
41
-
42
-
43
-
44
-
 45
45 -
 46
46 -
 47
47 -
 48
48 -
 49
49 -
 50
50 -
 51
51 -
 52
52 -
 53
53 -
 54
54 -
 55
55 -
 56
56 -
 57
57 -
 58
58 -
 59
59 -
 60
60 -
 61
61 -
 62
62 -
 63
63 -
 64
64 -
 65
65 -
66
-
67
-
68
-
69
-
70
-
71
-
72
-
73
-
74
-
75
-
76
-
77
-
78
-
79
-
80
-
81
-
82
 |
 |
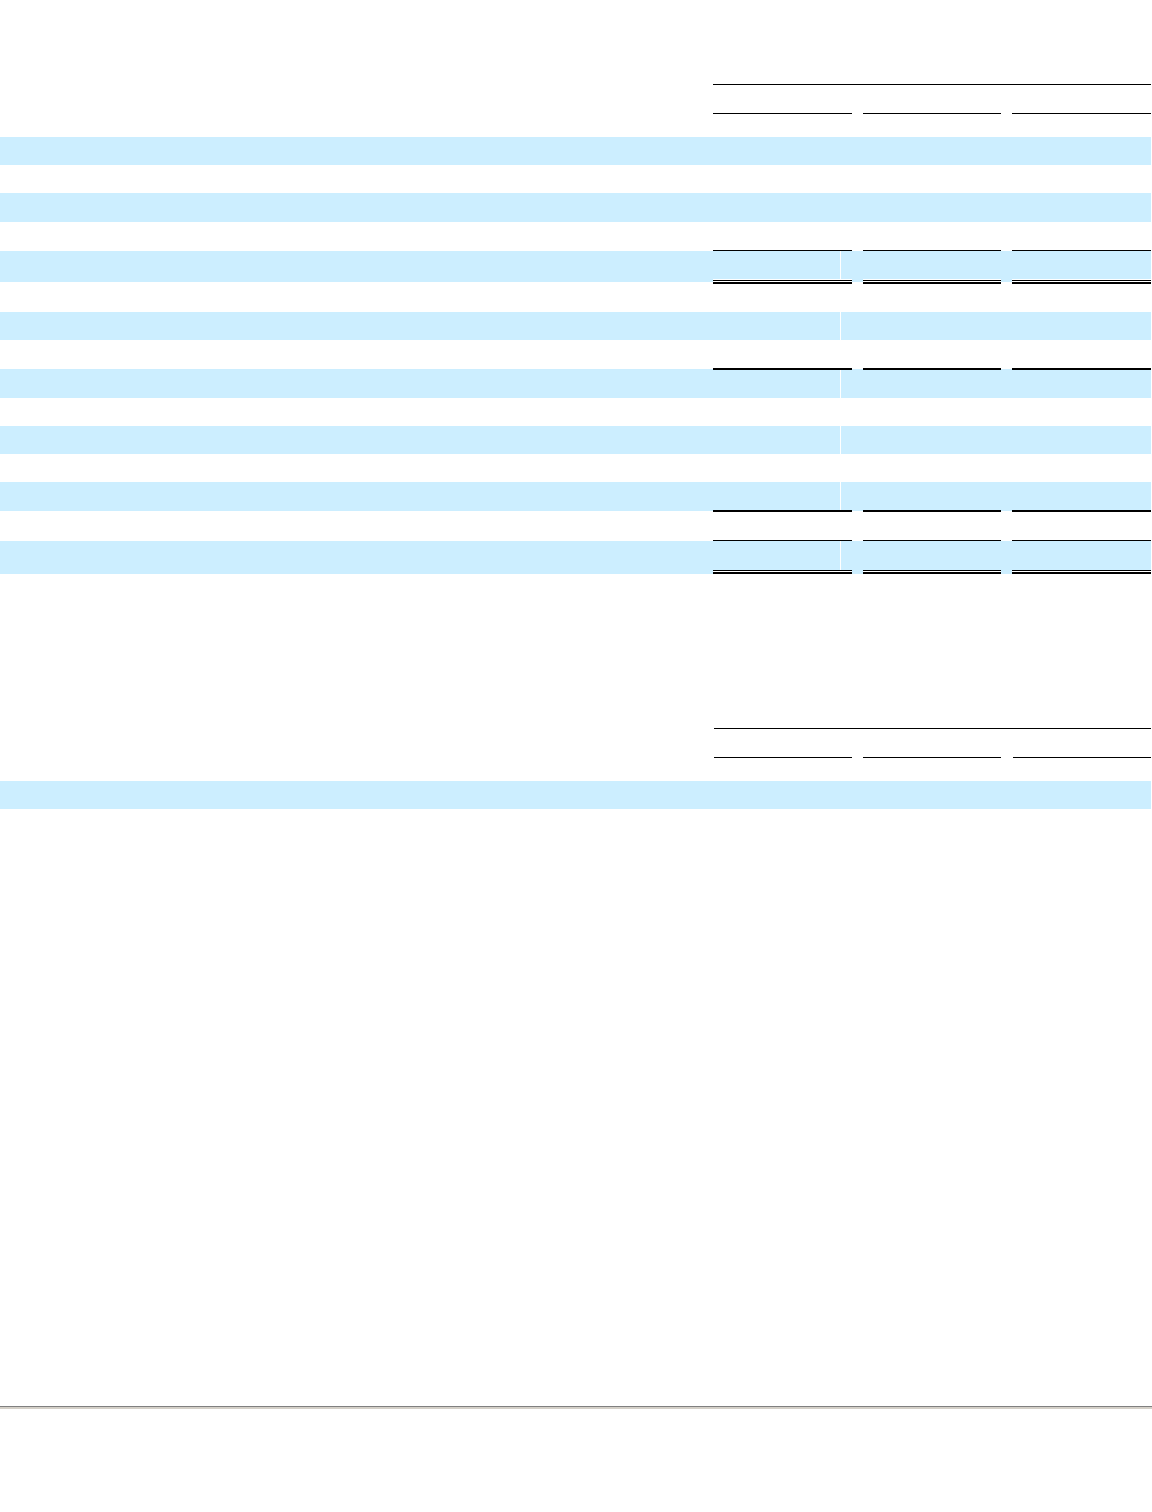
Table of Contents
Employee stock options with exercise prices greater than the average market price of the common stock were excluded from the diluted
calculation as their inclusion would have been anti-dilutive. The following table summarizes the potential common shares excluded from the
diluted calculation:
Stock
-Based Compensation
The Company grants fully vested non-qualified stock options to its employees on a monthly basis. As a result of immediate vesting,
stock-based compensation expense is fully recognized on the grant date, and no estimate is required for post-vesting option forfeitures. See
Note 8
to the consolidated financial statements for further information regarding stock-based compensation.
Certain prior year amounts have been reclassified to conform to the current year presentation in the consolidated financial statements.
Costs of revenues in the amount of $33.9 million and $26.2 million
for the years ended December 31, 2013 and 2012, respectively, related
to free-trial periods that were previously allocated to “Marketing” on the Consolidated Statements of Operations have been reallocated to “
Cost
of revenues”. There was no impact in any period presented to contribution profit or net income or to the Consolidated Balance Sheets or
Consolidated Statements of Cash Flows.
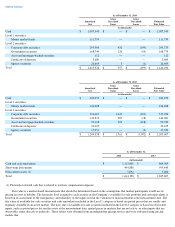
The Company’s investment policy is consistent with the definition of available-for-sale securities. The Company does not buy and hold
securities principally for the purpose of selling them in the near future. The Company’s policy is focused on the preservation of capital,
liquidity and return. From time to time, the Company may sell certain securities but the objectives are generally not to generate profits on short-
term differences in price. The following tables summarize, by major security type, the Company’s assets that are measured at fair value on a
recurring basis and are categorized using the fair value hierarchy and where they are classified on the consolidated balance sheets.
49
Year ended December 31,
2014
2013
2012
(in thousands, except per share data)
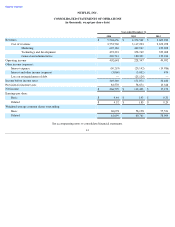
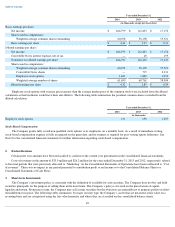
Basic earnings per share:
Net income
$
266,799
$
112,403
$
17,152
Shares used in computation:
Weighted-average common shares outstanding
60,078
58,198
55,521
Basic earnings per share
$
4.44
$
1.93
$
0.31
Diluted earnings per share:
Net income
$
266,799
$
112,403
$
17,152
Convertible Notes interest expense, net of tax —
49
195
Numerator for diluted earnings per share
266,799
112,452
17,347
Shares used in computation:
Weighted-average common shares outstanding
60,078
58,198
55,521
Convertible Notes shares —
715
2,331
Employee stock options
1,621
1,848
1,052
Weighted-average number of shares
61,699
60,761
58,904
Diluted earnings per share
$
4.32
$
1.85
$
0.29
Year ended December 31,
2014
2013
2012
(in thousands)
Employee stock options
131
198
1,207
2.
Reclassifications
3. Short-
term Investments