NetFlix 2014 Annual Report Download - page 22
Download and view the complete annual report
Please find page 22 of the 2014 NetFlix annual report below. You can navigate through the pages in the report by either clicking on the pages listed below, or by using the keyword search tool below to find specific information within the annual report.-
 1
1 -
2
-
3
-
4
-
5
-
6
-
7
-
8
-
9
-
10
-
11
-
 12
12 -
 13
13 -
 14
14 -
 15
15 -
 16
16 -
 17
17 -
 18
18 -
 19
19 -
 20
20 -
 21
21 -
 22
22 -
 23
23 -
 24
24 -
 25
25 -
 26
26 -
 27
27 -
 28
28 -
 29
29 -
 30
30 -
 31
31 -
 32
32 -
33
-
34
-
35
-
36
-
37
-
38
-
39
-
40
-
41
-
42
-
43
-
44
-
45
-
46
-
47
-
48
-
49
-
50
-
51
-
52
-
53
-
54
-
55
-
56
-
57
-
58
-
59
-
60
-
61
-
62
-
63
-
64
-
65
-
66
-
67
-
68
-
69
-
70
-
71
-
72
-
73
-
74
-
75
-
76
-
77
-
78
-
79
-
80
-
81
-
82
 |
 |
Table of Contents
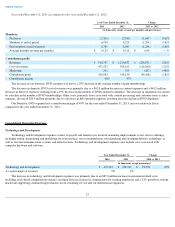
which our streaming service is offered and the timing of the launch of new territories. Marketing expenses are immaterial for the
Domestic DVD segment.
Segment Results
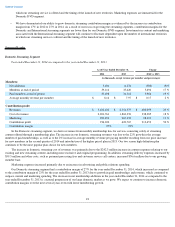
Domestic Streaming Segment
Year ended December 31, 2014 as compared to the year ended December 31, 2013
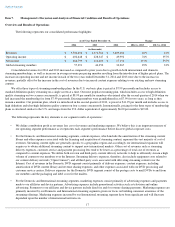
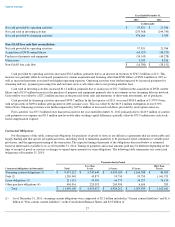
In the Domestic streaming segment, we derive revenues from monthly membership fees for services consisting solely of streaming
content offered through a membership plan. The increase in our domestic streaming revenues was due to the 22% growth in the average
number of paid memberships, as well as to the 2% increase in average monthly revenue per paying member resulting from our price increase
for new members in the second quarter of 2014 and introduction of the higher priced plan in 2013. Our two screen high definition plan
continues to be the most popular plan choice for new members.
The increase in domestic streaming cost of revenues was primarily due to the $242.3 million increase in content expenses relating to our
existing and new streaming content, including more exclusive and original programming. In addition, streaming delivery expenses increased by
$59.5 million and other costs, such as payment processing fees and customer service call centers, increased $36.6 million due to our growing
member base.
Marketing expenses increased primarily due to an increase in advertising and public relations spending.
Our Domestic streaming segment had a contribution margin of 27% for the year ended December 31, 2014, which increased as compared
to the contribution margin of 23% for the year ended December 31, 2013 due to growth in paid memberships and revenue, which continued to
outpace content and marketing spending. The decrease in net membership additions in the year ended December 31, 2014 as compared to the
year ended December 31, 2013 is a natural progression of our large domestic market as we grow. We expect to continue to increase domestic
contribution margins over the next several years even with lower membership growth.
18
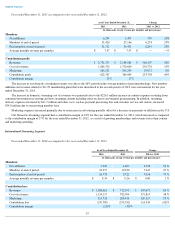
• We have demonstrated our ability to grow domestic streaming contribution margin as evidenced by the increase in contribution
margin from 17% in 2012 to 27% in 2014. As a result of our focus on growing the streaming segments, contribution margins for the
Domestic and International streaming segments are lower than for our Domestic DVD segment. Investments in content and marketing
associated with the International streaming segment will continue to fluctuate dependent upon the number of international territories
in which our streaming service is offered and the timing of the launch of new territories.
As of/ Year Ended December 31,
Change
2014
2013
2014 vs. 2013
(in thousands, except revenue per member and percentages)
Members:
Net additions
5,694
6,274
(580
)
(9
)%
Members at end of period
39,114
33,420
5,694
17
%
Paid members at end of period
37,698
31,712
5,986
19
%
Average monthly revenue per member
$
8.14
$
7.97
$
0.17
2
%
Contribution profit:
Revenues
$
3,431,434
$
2,751,375
$
680,059
25
%
Cost of revenues
2,201,761
1,863,376
338,385
18
%
Marketing
293,453
265,232
28,221
11
%
Contribution profit
936,220
622,767
313,453
50
%
Contribution margin
27
%
23
%