NetFlix 2014 Annual Report Download - page 30
Download and view the complete annual report
Please find page 30 of the 2014 NetFlix annual report below. You can navigate through the pages in the report by either clicking on the pages listed below, or by using the keyword search tool below to find specific information within the annual report.-
 1
1 -
2
-
3
-
4
-
5
-
6
-
7
-
8
-
9
-
10
-
11
-
12
-
13
-
14
-
15
-
16
-
17
-
18
-
19
-
 20
20 -
 21
21 -
 22
22 -
 23
23 -
 24
24 -
 25
25 -
 26
26 -
 27
27 -
 28
28 -
 29
29 -
 30
30 -
 31
31 -
 32
32 -
 33
33 -
 34
34 -
 35
35 -
 36
36 -
 37
37 -
 38
38 -
 39
39 -
 40
40 -
41
-
42
-
43
-
44
-
45
-
46
-
47
-
48
-
49
-
50
-
51
-
52
-
53
-
54
-
55
-
56
-
57
-
58
-
59
-
60
-
61
-
62
-
63
-
64
-
65
-
66
-
67
-
68
-
69
-
70
-
71
-
72
-
73
-
74
-
75
-
76
-
77
-
78
-
79
-
80
-
81
-
82
 |
 |

Table of Contents
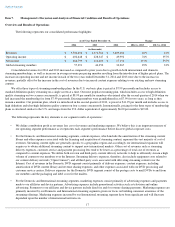
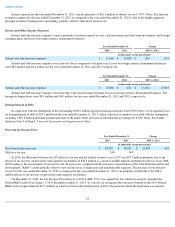
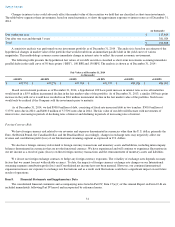
In 2013, the difference between our effective tax rate and the federal statutory rate of 35% was $1.2 million primarily due to the Federal
and California R&D credits partially offset by state income taxes and nondeductible expenses. The decrease in our effective tax rate for the
year ended December 31, 2013 as compared to the year ended December 31, 2012 was primarily attributable to the retroactive reinstatement of
the 2012 Federal R&D credit in January 2013.
On January 2, 2013, the American Taxpayer Relief Act of 2012 (H.R. 8) was signed into law which retroactively extended the Federal
R&D credit from January 1, 2012 through December 31, 2013. As a result, we recognized the retroactive benefit of the 2012 Federal R&D
credit of approximately $3.1 million as a discrete item in the first quarter of 2013, the period in which the legislation was enacted.
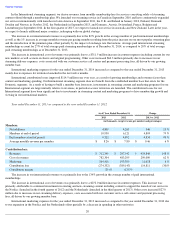
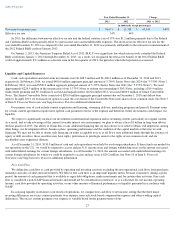
Liquidity and Capital Resources
Cash, cash equivalents and short-term investments were $1,608.5 million and $1,200.4 million as of December 31, 2014 and 2013,
respectively. In February 2014, we issued $400.0 million aggregate principal amount of 5.750% Senior Notes due 2024 (the "5.750% Notes").
In February 2013, we issued $500.0 million aggregate principal amount of 5.375% Senior Notes due 2021 (the "5.375% Notes"). We used
approximately $224.5 million of the net proceeds of our 5.375% Notes to redeem our outstanding 8.50% Notes, including a $19.4 million
make-whole premium and $5.1 million of accrued and unpaid interest. In November 2011, we issued $200.0 million of Senior Convertible
Notes. The Senior Convertible Notes consisted of $200.0 million aggregate principal amount due on December 1, 2018 and did not bear
interest. In April 2013, we exercised our option to cause the conversion of the Convertible Notes into shares of our common stock. See Note 5
of Item 8, Financial Statements and Supplementary Data for additional information.
Our primary uses of cash include content acquisition and licensing, streaming delivery, marketing programs and payroll. Payment terms
for certain content agreements require more upfront cash payments relative to the expense and therefore, future investments could impact our
liquidity.
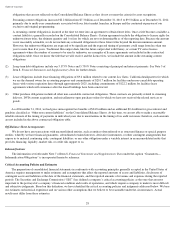
We expect to significantly increase our investments in international expansion and in streaming content, particularly in original content.
As a result, and to take advantage of the current favorable interest rate environment, we plan to obtain at least $1 billion in long-term debt in
the first quarter of 2015. Our ability to obtain this, or any additional financing that we may choose to or need to obtain, will depend on, among
other things, our development efforts, business plans, operating performance and the condition of the capital markets at the time we seek
financing. We may not be able to obtain such financing on terms acceptable to us or at all. If we raise additional funds through the issuance of
equity or debt securities, those securities may have rights, preferences or privileges senior to the rights of our common stock, and our
stockholders may experience dilution.
As of December 31, 2014, $130.8 million of cash and cash equivalents were held by our foreign subsidiaries. If these funds are needed for
our operations in the U.S., we would be required to accrue and pay U.S. income taxes and foreign withholding taxes on the amount associated
with undistributed earnings for certain foreign subsidiaries. As of December 31, 2014, the amount associated with undistributed earnings for
certain foreign subsidiaries for which we could be required to accrue and pay taxes is $29.2 million. See Note 10 of Item 8, Financial
Statements and Supplementary Data for additional information.
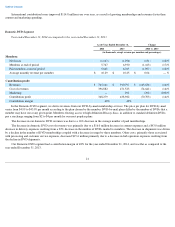
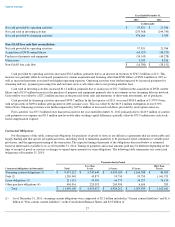
Free Cash Flow
We define free cash flow as cash provided by operating and investing activities excluding the non-operational cash flows from purchases,
maturities and sales of short-term investments. We believe free cash flow is an important liquidity metric because it measures, during a given
period, the amount of cash generated that is available to repay debt obligations, make investments and for certain other activities. Free cash
flow is considered a non-GAAP financial measure and should not be considered in isolation of, or as a substitute for, net income, operating
income, cash flow provided by operating activities, or any other measure of financial performance or liquidity presented in accordance with
GAAP.
In assessing liquidity in relation to our results of operations, we compare free cash flow to net income, noting that the three major
recurring differences are excess content payments over expense, non-cash stock-based compensation expense and other working capital
differences. The excess content payments over expense is variable based on the payment terms of our
25
Year Ended December 31,
Change
2013
2012
2013 vs. 2012
(in thousands, except percentages)
Provision for income taxes
$
58,671
$
13,328
$
45,343
340
%
Effective tax rate
34
%
44
%