NetFlix 2014 Annual Report Download - page 32
Download and view the complete annual report
Please find page 32 of the 2014 NetFlix annual report below. You can navigate through the pages in the report by either clicking on the pages listed below, or by using the keyword search tool below to find specific information within the annual report.-
 1
1 -
2
-
3
-
4
-
5
-
6
-
7
-
8
-
9
-
10
-
11
-
12
-
13
-
14
-
15
-
16
-
17
-
18
-
19
-
20
-
21
-
 22
22 -
 23
23 -
 24
24 -
 25
25 -
 26
26 -
 27
27 -
 28
28 -
 29
29 -
 30
30 -
 31
31 -
 32
32 -
 33
33 -
 34
34 -
 35
35 -
 36
36 -
 37
37 -
 38
38 -
 39
39 -
 40
40 -
 41
41 -
 42
42 -
43
-
44
-
45
-
46
-
47
-
48
-
49
-
50
-
51
-
52
-
53
-
54
-
55
-
56
-
57
-
58
-
59
-
60
-
61
-
62
-
63
-
64
-
65
-
66
-
67
-
68
-
69
-
70
-
71
-
72
-
73
-
74
-
75
-
76
-
77
-
78
-
79
-
80
-
81
-
82
 |
 |

Table of Contents
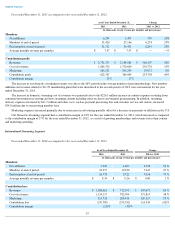
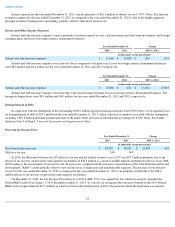
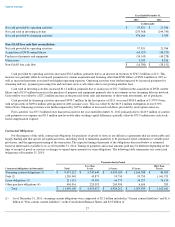
Cash provided by operating activities increased $76.2 million, primarily due to an increase in revenues of $765.3 million or 21%. This
increase was partially offset by increased payments for content acquisition and licensing other than DVD library of $502.6 million or 24% as
well as increased payments associated with higher operating expenses. Operating activities were further impacted by increased payments for
streaming delivery, payment processing fees and customer service call centers due to our growing member base.
Cash used in investing activities increased $11.2 million, primarily due to an increase of $17.7 million in the acquisition of DVD content
library and a $13.9 million increase in the purchase of property and equipment primarily due to investments in our streaming delivery network.
Cash outflow was offset by a $23.2 million increase in the proceeds from sales and maturities of short-term investments, net of purchases.
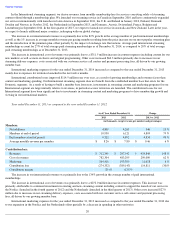
Cash provided by financing activities increased $470.7 million. In the first quarter of 2013, we issued $500.0 million of 5.375% Notes,
with net proceeds of $490.6 million after payment of debt issuance costs. This was offset by the $219.4 million redemption of our 8.50%
Senior Notes. Financing activities were further impacted by $197.6 million of increased cash flows provided by stock option exercises.
Free cash flow was $75.3 million lower than net income for the year ended December 31, 2012 primarily due to $143.9 million of content
cash payments over expense and $5.3 million non-favorable other working capital differences partially offset by $73.9 million non-cash stock-
based compensation expense.
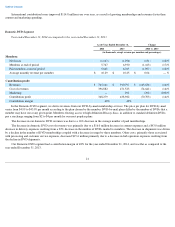
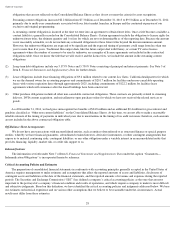
Contractual Obligations
For the purpose of this table, contractual obligations for purchases of goods or services are defined as agreements that are enforceable and
legally binding and that specify all significant terms, including: fixed or minimum quantities to be purchased; fixed, minimum or variable price
provisions; and the approximate timing of the transaction. The expected timing of payment of the obligations discussed below is estimated
based on information available to us as of December 31, 2014. Timing of payments and actual amounts paid may be different depending on the
time of receipt of goods or services or changes to agreed-upon amounts for some obligations. The following table summarizes our contractual
obligations at December 31, 2014:
27
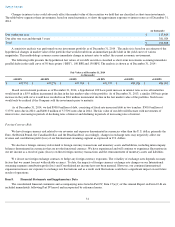
Year Ended December 31,
2013
2012
(in thousands)
Net cash provided by operating activities
$
97,831
$
21,586
Net cash used in investing activities
(255,968
)
(244,740
)
Net cash provided by financing activities
476,264
5,589
Non-GAAP free cash flow reconciliation:
Net cash provided by operating activities
97,831
21,586
Acquisition of DVD content library
(65,927
)
(48,275
)
Purchases of property and equipment
(54,143
)
(40,278
)
Other assets
5,939
8,816
Non-GAAP free cash flow
$
(16,300
)
$
(58,151
)
Payments due by Period
Contractual obligations (in thousands):
Total
Less than
1 year
1-3 years
3-5 years
More than
5 years
Streaming content obligations (1)
$
9,451,112
$
3,747,648
$
4,495,103
$
1,164,308
$
44,053
Debt (2)
1,290,948
49,875
99,750
99,750
1,041,573
Lease obligations (3)
211,133
35,501
64,775
34,727
76,130
Other purchase obligations (4)
496,916
220,393
269,584
6,654
285
Total
$
11,450,109
$
4,053,417
$
4,929,212
$
1,305,439
$
1,162,041
(1)
As of December 31, 2014, streaming content obligations were comprised of $2.1 billion included in "Current content liabilities" and $1.6
billion of "Non-current content liabilities" on the Consolidated Balance Sheets and $5.8 billion of