NetFlix 2014 Annual Report Download - page 25
Download and view the complete annual report
Please find page 25 of the 2014 NetFlix annual report below. You can navigate through the pages in the report by either clicking on the pages listed below, or by using the keyword search tool below to find specific information within the annual report.-
 1
1 -
2
-
3
-
4
-
5
-
6
-
7
-
8
-
9
-
10
-
11
-
12
-
13
-
14
-
 15
15 -
 16
16 -
 17
17 -
 18
18 -
 19
19 -
 20
20 -
 21
21 -
 22
22 -
 23
23 -
 24
24 -
 25
25 -
 26
26 -
 27
27 -
 28
28 -
 29
29 -
 30
30 -
 31
31 -
 32
32 -
 33
33 -
 34
34 -
 35
35 -
36
-
37
-
38
-
39
-
40
-
41
-
42
-
43
-
44
-
45
-
46
-
47
-
48
-
49
-
50
-
51
-
52
-
53
-
54
-
55
-
56
-
57
-
58
-
59
-
60
-
61
-
62
-
63
-
64
-
65
-
66
-
67
-
68
-
69
-
70
-
71
-
72
-
73
-
74
-
75
-
76
-
77
-
78
-
79
-
80
-
81
-
82
 |
 |

Table of Contents
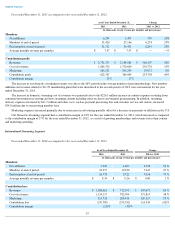
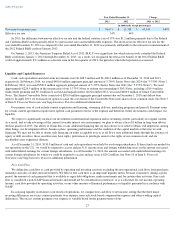
International contribution losses improved $114.8 million year over year, as a result of growing memberships and revenues faster than
content and marketing spending.
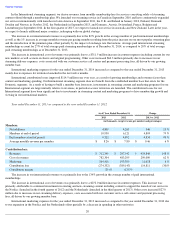
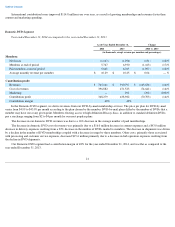
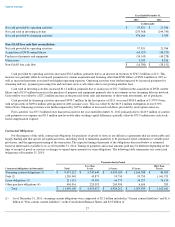
Domestic DVD Segment
Year ended December 31, 2014 as compared to the year ended December 31, 2013
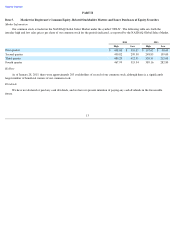
In the Domestic DVD segment, we derive revenues from our DVD-by-mail membership services. The price per plan for DVD-by-mail
varies from $4.99 to $43.99 per month according to the plan chosen by the member. DVD-by-mail plans differ by the number of DVDs that a
member may have out at any given point. Members electing access to high definition Blu-ray discs, in addition to standard definition DVDs,
pay a surcharge ranging from $2 to $4 per month for our most popular plans.
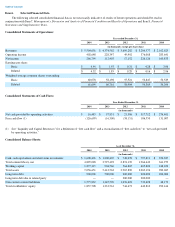
The decrease in our domestic DVD revenues was due to a 16% decrease in the average number of paid memberships.
The decrease in domestic DVD cost of revenues was primarily due to a $16.0 million decrease in content expenses and a $43.0 million
decrease in delivery expenses resulting from a 22% decrease in the number of DVDs mailed to members. The decrease in shipments was driven
by a decline in the number of DVD memberships coupled with a decrease in usage by these members. Other costs, primarily those associated
with processing and customer service expenses, decreased $15.6 million primarily due to a decrease in hub operation expenses resulting from
the decline in DVD shipments.
Our Domestic DVD segment had a contribution margin of 48% for the year ended December 31, 2014, and was flat as compared to the
year ended December 31, 2013.
21
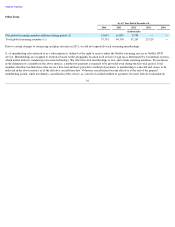
As of/ Year Ended December 31,
Change
2014
2013
2014 vs. 2013
(in thousands, except revenue per member and percentages)
Members:
Net losses
(1,163
)
(1,294
)
(131
)
(10
)%
Members at end of period
5,767
6,930
(1,163
)
(17
)%
Paid members at end of period
5,668
6,765
(1,097
)
(16
)%
Average monthly revenue per member
$
10.29
$
10.25
$
0.04
—
%
Contribution profit:
Revenues
$
765,161
$
910,797
$
(145,636
)
(16
)%
Cost of revenues
396,882
471,523
(74,641
)
(16
)%
Marketing
—
292
(292
)
(100
)%
Contribution profit
368,279
438,982
(70,703
)
(16
)%
Contribution margin
48
%
48
%