NetFlix 2010 Annual Report Download - page 70
Download and view the complete annual report
Please find page 70 of the 2010 NetFlix annual report below. You can navigate through the pages in the report by either clicking on the pages listed below, or by using the keyword search tool below to find specific information within the annual report.-
 1
1 -
2
-
3
-
4
-
5
-
6
-
7
-
8
-
9
-
10
-
11
-
12
-
13
-
14
-
15
-
16
-
17
-
18
-
19
-
20
-
21
-
22
-
23
-
24
-
25
-
26
-
27
-
28
-
29
-
30
-
31
-
32
-
33
-
34
-
35
-
36
-
37
-
38
-
39
-
40
-
41
-
42
-
43
-
44
-
45
-
46
-
47
-
48
-
49
-
50
-
51
-
52
-
53
-
54
-
55
-
56
-
57
-
58
-
59
-
 60
60 -
 61
61 -
 62
62 -
 63
63 -
 64
64 -
 65
65 -
 66
66 -
 67
67 -
 68
68 -
 69
69 -
 70
70 -
 71
71 -
 72
72 -
 73
73 -
 74
74 -
 75
75 -
 76
76
 |
 |

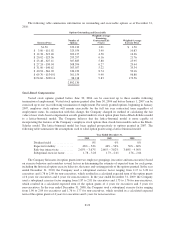
11. Selected Quarterly Financial Data (Unaudited)
December 31 September 30 June 30 March 31
(in thousands)
2010
Total revenues ...................................... $595,922 $553,219 $519,819 $493,665
Gross profit ........................................ 205,132 208,750 204,885 186,503
Net income ........................................ 47,095 37,967 43,519 32,272
Net income per share:
Basic ......................................... $ 0.90 $ 0.73 $ 0.83 $ 0.61
Diluted ....................................... 0.87 0.70 0.80 0.59
2009
Total revenues ...................................... $444,542 $423,120 $408,509 $394,098
Gross profit ........................................ 169,056 147,846 139,266 134,830
Net income ........................................ 30,913 30,141 32,443 22,363
Net income per share:
Basic ......................................... $ 0.58 $ 0.54 $ 0.56 $ 0.38
Diluted ....................................... 0.56 0.52 0.54 0.37
F-26