NetFlix 2010 Annual Report Download - page 33
Download and view the complete annual report
Please find page 33 of the 2010 NetFlix annual report below. You can navigate through the pages in the report by either clicking on the pages listed below, or by using the keyword search tool below to find specific information within the annual report.-
 1
1 -
2
-
3
-
4
-
5
-
6
-
7
-
8
-
9
-
10
-
11
-
12
-
13
-
14
-
15
-
16
-
17
-
18
-
19
-
20
-
21
-
22
-
 23
23 -
 24
24 -
 25
25 -
 26
26 -
 27
27 -
 28
28 -
 29
29 -
 30
30 -
 31
31 -
 32
32 -
 33
33 -
 34
34 -
 35
35 -
 36
36 -
 37
37 -
 38
38 -
 39
39 -
 40
40 -
 41
41 -
 42
42 -
 43
43 -
44
-
45
-
46
-
47
-
48
-
49
-
50
-
51
-
52
-
53
-
54
-
55
-
56
-
57
-
58
-
59
-
60
-
61
-
62
-
63
-
64
-
65
-
66
-
67
-
68
-
69
-
70
-
71
-
72
-
73
-
74
-
75
-
76
 |
 |

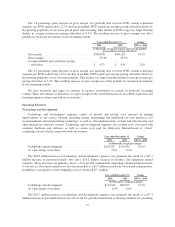
In 2009, our effective tax rate differed from the federal statutory rate of 35% principally due to state income
taxes of $10.4 million or 5.4% of income before income tax. This was partially offset by Federal and California
R&D tax credits of $1.6 million. The increase in our effective tax rate was primarily attributable to a cumulative
benefit recorded as a discrete item in the second quarter of 2008 for prior period R&D tax credits.
Liquidity and Capital Resources
Our primary source of liquidity has been cash generated from operations. Additionally, in November 2009,
we issued $200 million of our 8.50% senior notes due in 2017. Our primary uses of cash include payroll,
advertising and payments to consumer electronics partners, stock repurchases, acquisition and licensing of
content, content delivery, fulfillment expenses, taxes and capital expenditures related to information technology
and automation equipment. We expect to continue to make substantial investments to obtain content, and in
particular expect to increase spending associated with streaming content. Streaming content commitments have
grown and continue to grow as we typically enter into multi-year, fixed-fee licenses. These investments could
impact our liquidity and in particular our operating cash flows.
Although we currently anticipate that cash flows from operations, together with our available funds, will
continue to be sufficient to meet our cash needs for the foreseeable future, we may require or choose to obtain
additional financing. Our ability to obtain additional financing will depend on, among other things, our
development efforts, business plans, operating performance and the condition of the capital markets at the time
we seek financing.
On June 11, 2010, we announced that our Board of Directors authorized a stock repurchase program
allowing us to repurchase $300 million of our common stock through the end of 2012. As of December 31, 2010,
$240.6 million of this authorization is remaining. The timing and actual number of shares repurchased will
depend on various factors, including price, corporate and regulatory requirements, debt covenant requirements,
alternative investment opportunities and other market conditions.
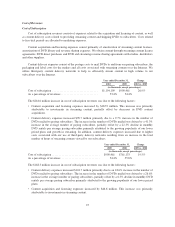
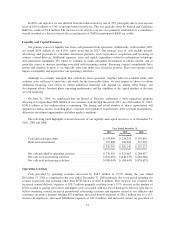
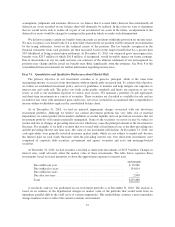
The following table highlights selected measures of our liquidity and capital resources as of December 31,
2010, 2009 and 2008:
Year Ended December 31,
2010 2009 2008
(in thousands)
Cash and cash equivalents ............................ $194,499 $ 134,224 $ 139,881
Short-term investments .............................. 155,888 186,018 157,390
$ 350,387 $ 320,242 $ 297,271
Net cash provided by operating activities ................ $276,401 $ 325,063 $ 284,037
Net cash used in investing activities .................... $(116,081) $(246,079) $(144,960)
Net cash used in financing activities .................... $(100,045) $ (84,641) $(176,635)
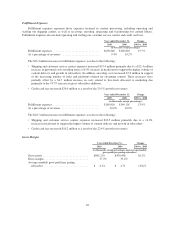
Operating Activities
Cash provided by operating activities decreased by $48.7 million or 15.0% during the year ended
December 31, 2010 as compared to the year ended December 31, 2009 primarily due to increased spending for
content acquisition and licensing other than DVD library of $267.8 million. This increase was coupled with
increased content delivery expenses of $78.7 million primarily resulting from a 9.7% increase in the number of
DVDs mailed to paying subscribers and higher costs associated with our use of third-party delivery networks to
deliver streaming content, increased promotional advertising activities and expenses related to our affiliates and
consumer electronics partners totaling $33.6 million, increased payroll expenses of $36.2 million due to a 11%
increase in employees, increased fulfillment expenses of $33.4 million, and increased current tax provision of
31