NetFlix 2010 Annual Report Download - page 24
Download and view the complete annual report
Please find page 24 of the 2010 NetFlix annual report below. You can navigate through the pages in the report by either clicking on the pages listed below, or by using the keyword search tool below to find specific information within the annual report.-
 1
1 -
2
-
3
-
4
-
5
-
6
-
7
-
8
-
9
-
10
-
11
-
12
-
13
-
 14
14 -
 15
15 -
 16
16 -
 17
17 -
 18
18 -
 19
19 -
 20
20 -
 21
21 -
 22
22 -
 23
23 -
 24
24 -
 25
25 -
 26
26 -
 27
27 -
 28
28 -
 29
29 -
 30
30 -
 31
31 -
 32
32 -
 33
33 -
 34
34 -
35
-
36
-
37
-
38
-
39
-
40
-
41
-
42
-
43
-
44
-
45
-
46
-
47
-
48
-
49
-
50
-
51
-
52
-
53
-
54
-
55
-
56
-
57
-
58
-
59
-
60
-
61
-
62
-
63
-
64
-
65
-
66
-
67
-
68
-
69
-
70
-
71
-
72
-
73
-
74
-
75
-
76
 |
 |

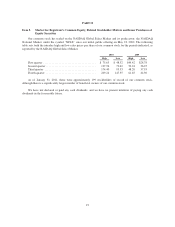
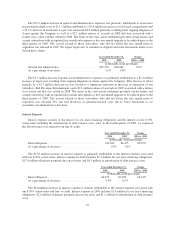
(4) Subscriber acquisition cost is defined as total marketing expenses divided by total gross subscriber additions
during the period.
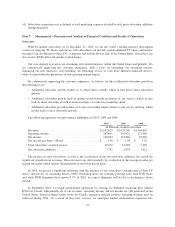
Item 7. Management’s Discussion and Analysis of Financial Condition and Results of Operations
Overview
With 20 million subscribers as of December 31, 2010, we are the world’s leading Internet subscription
service for enjoying TV shows and movies. Our subscribers can instantly watch unlimited TV shows and movies
streamed over the Internet to their TVs, computers and mobile devices and, in the United States, subscribers can
also receive DVDs delivered quickly to their homes.
Our core strategy is to grow our streaming subscription business within the United States and globally. We
are continuously improving the customer experience, with a focus on expanding our streaming content,
enhancing our user interfaces, and extending our streaming service to even more Internet-connected devices,
while staying within the parameters of our operating margin targets.
By continuously improving the customer experience, we believe we drive additional subscriber growth in
the following ways:
• Additional subscriber growth enables us to obtain more content, which in turn drives more subscriber
growth.
• Additional subscriber growth leads to greater word-of-mouth promotion of our service, which in turn
leads to more subscriber growth at an increasingly cost-effective marketing spend.
• Additional subscriber growth enables us to invest in further improvements to our service offering, which
in turn leads to more subscriber growth.
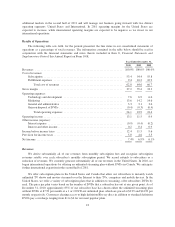
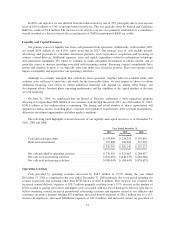
The following represents our performance highlights for 2010, 2009 and 2008:
2010 2009 2008
(in thousands, except per share data)
Revenues ....................................... $2,162,625 $1,670,269 $1,364,661
Operating income ................................ 283,641 191,939 121,506
Net income ..................................... 160,853 115,860 83,026
Net income per share—diluted ...................... $ 2.96 $ 1.98 $ 1.32
Total subscribers at end of period .................... 20,010 12,268 9,390
Net subscriber additions ........................... 7,742 2,878 1,911
The increase in total subscribers, as well as the acceleration in our net subscriber additions, has fueled the
significant growth in our revenues. These increases are offset partially by a reduction in the average revenue per
paying subscriber which reflects the popularity of our lower priced plans.
In 2010, we passed a significant milestone with the majority of our subscribers viewing more of their TV
shows and movies via streaming than by DVD. Streaming hours are currently growing faster than DVD hours
and while DVD shipments have grown 9.7% in 2010, we expect shipments will be flat to declining in future
periods.
In September 2010, we began international operations by offering an unlimited streaming plan without
DVDs in Canada. Substantially all of our revenues, operating income and net income are still generated in the
United States; however initial results from our Canada expansion indicate positive operating margins may be
achieved during 2011. As a result of this early success, we anticipate further international expansion into
22