NetFlix 2010 Annual Report Download - page 23
Download and view the complete annual report
Please find page 23 of the 2010 NetFlix annual report below. You can navigate through the pages in the report by either clicking on the pages listed below, or by using the keyword search tool below to find specific information within the annual report.-
 1
1 -
2
-
3
-
4
-
5
-
6
-
7
-
8
-
9
-
10
-
11
-
12
-
 13
13 -
 14
14 -
 15
15 -
 16
16 -
 17
17 -
 18
18 -
 19
19 -
 20
20 -
 21
21 -
 22
22 -
 23
23 -
 24
24 -
 25
25 -
 26
26 -
 27
27 -
 28
28 -
 29
29 -
 30
30 -
 31
31 -
 32
32 -
 33
33 -
34
-
35
-
36
-
37
-
38
-
39
-
40
-
41
-
42
-
43
-
44
-
45
-
46
-
47
-
48
-
49
-
50
-
51
-
52
-
53
-
54
-
55
-
56
-
57
-
58
-
59
-
60
-
61
-
62
-
63
-
64
-
65
-
66
-
67
-
68
-
69
-
70
-
71
-
72
-
73
-
74
-
75
-
76
 |
 |

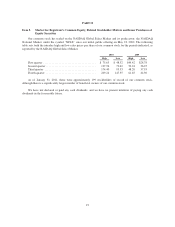
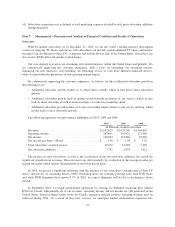
Item 6. Selected Financial Data
The following selected financial data is not necessarily indicative of results of future operations and should
be read in conjunction with Item 7, Management’s Discussion and Analysis of Financial Condition and Results
of Operations and Item 8, Financial Statements and Supplementary Data.
Year ended December 31,
2010 2009 2008 2007 (1) 2006
(in thousands, except per share data)
Revenues ............................. $2,162,625 $1,670,269 $1,364,661 $1,205,340 $996,660
Total cost of revenues ................... 1,357,355 1,079,271 910,234 786,168 626,985
Operating income ....................... 283,641 191,939 121,506 91,773 65,218
Net income ............................ 160,853 115,860 83,026 66,608 48,839
Net income per share:
Basic ............................. $ 3.06 $ 2.05 $ 1.36 $ 0.99 $ 0.78
Diluted ........................... $ 2.96 $ 1.98 $ 1.32 $ 0.97 $ 0.71
Weighted-average shares outstanding:
Basic ............................. 52,529 56,560 60,961 67,076 62,577
Diluted ........................... 54,304 58,416 62,836 68,902 69,075
Notes:
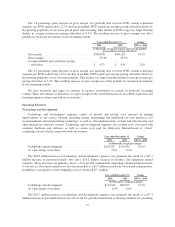
(1) Operating expenses for the year includes a one-time payment received in the amount of $7.0 million as a
result of resolving a patent litigation with Blockbuster, Inc.
As of December 31,
2010 2009 (3) 2008 2007 2006
(in thousands)
Balance Sheet Data:
Cash and cash equivalents ......... $194,499 $134,224 $139,881 $177,439 $400,430
Short-term investments (2) ......... 155,888 186,018 157,390 207,703 —
Working capital ................. 252,388 183,577 142,908 223,518 234,582
Total assets ..................... 982,067 679,734 615,424 678,998 633,013
Long-term debt .................. 200,000 200,000 — — —
Lease financing obligations,
excluding current portion ........ 34,123 36,572 37,988 35,652 23,798
Other non-current liabilities ........ 69,201 16,583 14,264 4,629 1,761
Stockholders’ equity .............. 290,164 199,143 347,155 429,812 413,618
(2) Short-term investments are comprised of corporate debt securities, government and agency securities and
asset and mortgage-backed securities.
(3) Certain amounts as of December 31, 2009 have been reclassified to conform to the current period
presentation.
As of / Year Ended December 31,
2010 2009 2008 2007 2006
(in thousands, except subscriber acquisition cost)
Other Data:
Total subscribers at end of period ........... 20,010 12,268 9,390 7,479 6,316
Gross subscriber additions during period ...... 16,301 9,332 6,859 5,340 5,250
Net subscriber additions during period ....... 7,742 2,878 1,911 1,163 2,137
Subscriber acquisition cost (4) .............. $ 18.03 $ 25.48 $29.12 $40.86 $42.94
21