NetFlix 2010 Annual Report Download - page 67
Download and view the complete annual report
Please find page 67 of the 2010 NetFlix annual report below. You can navigate through the pages in the report by either clicking on the pages listed below, or by using the keyword search tool below to find specific information within the annual report.-
 1
1 -
2
-
3
-
4
-
5
-
6
-
7
-
8
-
9
-
10
-
11
-
12
-
13
-
14
-
15
-
16
-
17
-
18
-
19
-
20
-
21
-
22
-
23
-
24
-
25
-
26
-
27
-
28
-
29
-
30
-
31
-
32
-
33
-
34
-
35
-
36
-
37
-
38
-
39
-
40
-
41
-
42
-
43
-
44
-
45
-
46
-
47
-
48
-
49
-
50
-
51
-
52
-
53
-
54
-
55
-
56
-
 57
57 -
 58
58 -
 59
59 -
 60
60 -
 61
61 -
 62
62 -
 63
63 -
 64
64 -
 65
65 -
 66
66 -
 67
67 -
 68
68 -
 69
69 -
 70
70 -
 71
71 -
 72
72 -
 73
73 -
 74
74 -
 75
75 -
 76
76
 |
 |

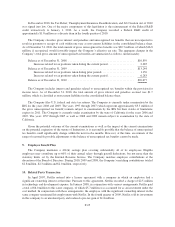
The fair value of shares issued under the ESPP is estimated using the Black-Scholes option pricing model.
The following table summarizes the assumptions used to value shares under the ESPP:
Year Ended December 31,
2010 2009 2008
Dividend yield ........................ 0% 0% 0%
Expected volatility ..................... 45% 42%–55% 55%–60%
Risk-free interest rate .................. 0.24% 0.16% – 0.35% 1.23% – 1.58%
Expected life (in years) ................. 0.5 0.5 0.5
The Company estimates expected volatility based on a blend of historical volatility of the Company’s
common stock and implied volatility of tradable forward call options to purchase shares of its common stock.
The Company believes that implied volatility of publicly traded options in its common stock is expected to be
more reflective of market conditions and, therefore, can reasonably be expected to be a better indicator of
expected volatility than historical volatility of its common stock.
In valuing shares issued under the Company’s employee stock options, the Company bases the risk-free
interest rate on U.S. Treasury zero-coupon issues with terms similar to the contractual term of the options. In
valuing shares issued under the Company’s ESPP, the Company bases the risk-free interest rate on U.S. Treasury
zero-coupon issues with terms similar to the expected term of the shares. The Company does not anticipate
paying any cash dividends in the foreseeable future and therefore uses an expected dividend yield of zero in the
option valuation model. The Company does not use a post-vesting termination rate as options are fully vested
upon grant date. The weighted-average fair value of employee stock options granted during 2010, 2009 and 2008
was $49.31, $17.79 and $12.25 per share, respectively. The weighted-average fair value of shares granted under
the employee stock purchase plan during 2010, 2009 and 2008 was $21.27, $10.53 and $8.28 per share,
respectively.
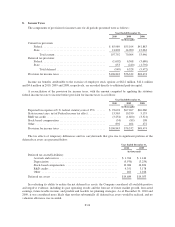
The following table summarizes stock-based compensation expense, net of tax, related to stock option plans
and employee stock purchases which were allocated as follows:
Year Ended December 31,
2010 2009 2008
(in thousands)
Fulfillment expenses ..................................... $ 1,145 $ 380 $ 466
Technology and development .............................. 10,189 4,453 3,890
Marketing ............................................. 3,043 1,786 1,886
General and administrative ................................ 13,619 5,999 6,022
Stock-based compensation expense before income taxes ......... 27,996 12,618 12,264
Income tax benefit ....................................... (11,161) (5,017) (4,585)
Total stock-based compensation after income taxes ............. $16,835 $ 7,601 $ 7,679
F-23