NetFlix 2010 Annual Report Download - page 56
Download and view the complete annual report
Please find page 56 of the 2010 NetFlix annual report below. You can navigate through the pages in the report by either clicking on the pages listed below, or by using the keyword search tool below to find specific information within the annual report.-
 1
1 -
2
-
3
-
4
-
5
-
6
-
7
-
8
-
9
-
10
-
11
-
12
-
13
-
14
-
15
-
16
-
17
-
18
-
19
-
20
-
21
-
22
-
23
-
24
-
25
-
26
-
27
-
28
-
29
-
30
-
31
-
32
-
33
-
34
-
35
-
36
-
37
-
38
-
39
-
40
-
41
-
42
-
43
-
44
-
45
-
 46
46 -
 47
47 -
 48
48 -
 49
49 -
 50
50 -
 51
51 -
 52
52 -
 53
53 -
 54
54 -
 55
55 -
 56
56 -
 57
57 -
 58
58 -
 59
59 -
 60
60 -
 61
61 -
 62
62 -
 63
63 -
 64
64 -
 65
65 -
 66
66 -
67
-
68
-
69
-
70
-
71
-
72
-
73
-
74
-
75
-
76
 |
 |

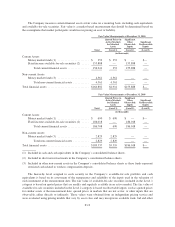
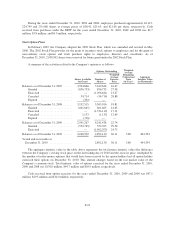
2. Short-term Investments
The Company’s investment policy is consistent with the definition of available-for-sale securities. The
Company does not buy and hold securities principally for the purpose of selling them in the near future. The
Company’s policy is focused on the preservation of capital, liquidity and return. From time to time, the Company
may sell certain securities but the objectives are generally not to generate profits on short-term differences in
price. Short-term investments are therefore classified as available-for-sale securities and are reported at fair value
as follows:
December 31, 2010
Amortized
Cost
Gross
Unrealized
Gains
Gross
Unrealized
Losses
Estimated
Fair Value
(in thousands)
Corporate debt securities ..................... $109,745 $1,043 $(101) $110,687
Government and agency securities ............. 42,062 331 (101) 42,292
Asset and mortgage backed securities ........... 2,881 168 (140) 2,909
$154,688 $1,542 $(342) $155,888
December 31, 2009
Amortized
Cost
Gross
Unrealized
Gains
Gross
Unrealized
Losses
Estimated
Fair Value
(in thousands)
Corporate debt securities ..................... $ 82,362 $ 915 $(106) $ 83,171
Government and agency securities ............. 96,998 72 (416) 96,654
Asset and mortgage backed securities ........... 6,262 143 (212) 6,193
$185,622 $1,130 $(734) $186,018
Because the Company does not intend to sell the investments that are in an unrealized loss position and it is
not likely that the Company will be required to sell the investments before recovery of their amortized cost basis,
the Company does not consider those investments with an unrealized loss to be other-than-temporarily impaired
at December 31, 2010. There were no material other-than-temporary impairments or credit losses related to
available-for-sale securities in 2010, 2009 or 2008.
The gross realized gains on the sales of available-for-sale securities for the three years ended December 31,
2010, 2009 and 2008 were $1.0 million, $1.9 million and $4.9 million, respectively. There were no material gross
realized losses from the sale of available-for-sale investments for the years ended December 31, 2010 and 2009.
The gross realized losses on the sales of available-for-sale securities for the year ended 2008 were $1.8 million.
Realized gains and losses and interest income are included in interest and other income.
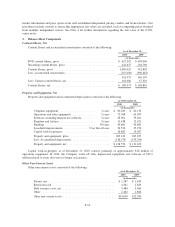
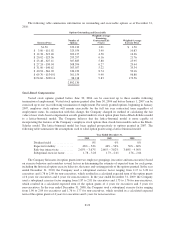
The estimated fair value of short-term investments by contractual maturity as of December 31, 2010 is as
follows:
(in thousands)
Due within one year .............................................. $ 18,966
Due after one year and through 5 years ............................... 134,014
Due after 5 years and through 10 years ............................... —
Due after 10 years ............................................... 2,908
Total short-term investments ....................................... $155,888
F-12