NetFlix 2010 Annual Report Download - page 34
Download and view the complete annual report
Please find page 34 of the 2010 NetFlix annual report below. You can navigate through the pages in the report by either clicking on the pages listed below, or by using the keyword search tool below to find specific information within the annual report.-
 1
1 -
2
-
3
-
4
-
5
-
6
-
7
-
8
-
9
-
10
-
11
-
12
-
13
-
14
-
15
-
16
-
17
-
18
-
19
-
20
-
21
-
22
-
23
-
 24
24 -
 25
25 -
 26
26 -
 27
27 -
 28
28 -
 29
29 -
 30
30 -
 31
31 -
 32
32 -
 33
33 -
 34
34 -
 35
35 -
 36
36 -
 37
37 -
 38
38 -
 39
39 -
 40
40 -
 41
41 -
 42
42 -
 43
43 -
 44
44 -
45
-
46
-
47
-
48
-
49
-
50
-
51
-
52
-
53
-
54
-
55
-
56
-
57
-
58
-
59
-
60
-
61
-
62
-
63
-
64
-
65
-
66
-
67
-
68
-
69
-
70
-
71
-
72
-
73
-
74
-
75
-
76
 |
 |
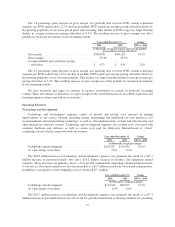
$30.5 million. In addition, excess tax benefits from stock-based compensation increased by $49.5 million. The
increase in these expenses was partially offset by an increase in subscription revenues of $492.4 million resulting
from a 41.3% increase in the average number of paying subscribers.
Cash provided by operating activities increased by $41.0 million or 14.4% during the year ended
December 31, 2009 as compared to the year ended December 31, 2008 primarily due to an increase in
subscription revenues of $305.6 million resulting from a 26.6% increase in the average number of paying
subscribers. This increase in subscription revenues was partially offset by an increase in spending for content
acquisition and licensing other than DVD library of $67.7 million. This increase was coupled with increased
content delivery expenses of $101.7 million primarily resulting from an 18.6% increase in the number of DVDs
mailed to paying subscribers and higher costs associated with our use of third-party delivery networks to deliver
streaming content, increased promotional advertising activities and expenses related to our affiliates and
consumer electronic partners totaling $32.9 million, increased payroll expenses of $27.3 million due to a 25%
increase in employees, increased fulfillment expenses of $20.7 million, and increased current tax provision of
$27.9 million.
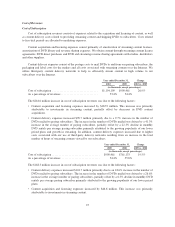
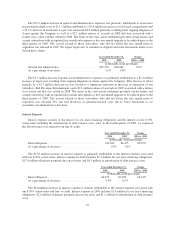
Investing Activities
Cash used in investing activities during the year ended December 31, 2010 decreased $130.0 million as
compared to the year ended December 31, 2009 primarily due to a $120.6 million decrease in the purchases of
available-for-sale securities and a $69.1 million decrease in acquisitions of DVD content library, as more DVDs
were obtained through revenue sharing arrangements. In addition, purchases of property and equipment
decreased by $12.1 million, as a significant amount of payments for automation equipment for our various
shipping centers were made in 2009. This decrease was partially offset by a $65.7 million decrease in proceeds
from the sales and maturities of available-for-sale securities.
Cash used in investing activities during the year ended December 31, 2009 increased $101.1 million as
compared to the year ended December 31, 2008 primarily due to a $105.0 million decrease in the proceeds from
the sales and maturities of available-for-sale securities partially offset by a decrease in the purchases of
available-for-sale securities of $29.0 million. In addition, acquisitions of DVDs increased by $30.2 million.
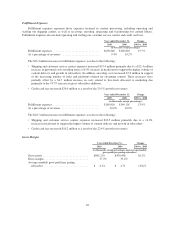
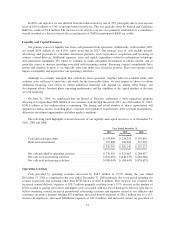
Financing Activities
Cash used in financing activities during the year ended December 31, 2010 increased $15.4 million as
compared to the year ended December 31, 2009 primarily due to the $193.9 million net proceeds received from
the issuance of our 8.50% senior notes in 2009. This decrease was partially offset by a $114.1 million decrease in
repurchases of our common stock coupled with a $49.5 million increase in the excess tax benefits from stock-
based compensation and a $14.5 million increase in proceeds from the issuance of common stock.
Cash used in financing activities during the year ended December 31, 2009 decreased by $92.0 million as
compared to 2008 primarily due to the $193.9 million net proceeds received from the issuance of our 8.50%
senior notes and a $16.4 million increase in proceeds received from the issuance of common stock. In addition,
the excess tax benefits from stock-based compensation increased by $7.5 million in 2009. These cash inflows
were offset by an increase in repurchases of our common stock of $124.4 million.
Free Cash Flow
We define free cash flow as cash provided by operating and investing activities excluding the
non-operational cash flows from purchases and sales of short-term investments and cash flows from investments
in businesses. We believe free cash flow is an important liquidity metric because it measures, during a given
period, the amount of cash generated that is available to repay debt obligations, make investments, repurchase
our stock, and for certain other activities. Free cash flow is considered a non-GAAP financial measure and should
not be considered in isolation of, or as a substitute for, net income, operating income, cash flow from operating
32