NetFlix 2010 Annual Report Download - page 30
Download and view the complete annual report
Please find page 30 of the 2010 NetFlix annual report below. You can navigate through the pages in the report by either clicking on the pages listed below, or by using the keyword search tool below to find specific information within the annual report.
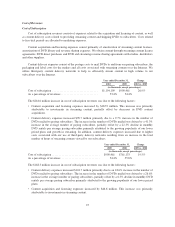
content and continued improvements to our service. The increase is also partly due to a $6.7 million increase in
facilities and equipment expenses to support the increased headcount and overall growth of operations.
Marketing
Marketing expenses consist primarily of advertising expenses and also include payments made to our
affiliates and consumer electronics partners and payroll related expenses. Advertising expenses include
promotional activities such as television and online advertising as well as, allocated costs of revenues relating to
free trial periods. Payments to our affiliates and consumer electronics partners, may be in the form of a fixed-fee
or may be a revenue sharing payment.
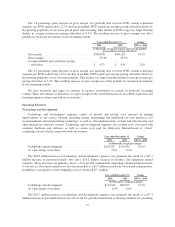
Year ended December 31, Change
2010 2009 2010 vs. 2009
(in thousands, except percentages and
subscriber acquisition cost)
Marketing .................................... $293,839 $237,744 23.6%
As a percentage of revenues .................. 13.6% 14.2%
Other Data:
Gross subscriber additions ................... 16,301 9,332 74.7%
Subscriber acquisition cost ................... $ 18.03 $ 25.48 (29.2)%
The $56.1 million increase in marketing expenses was primarily attributable to an increase of $17.4 million
in spending related to our consumer electronics partners, as we continued to expand the number of devices on
which subscribers can view Netflix content. The increase is also due to a $16.2 million increase in other
marketing program spending, principally in TV and radio advertising to promote our service, offset by a decrease
in direct mail and inserts. In addition, costs of free trials increased $21.0 million due to the 74.7% increase in
gross subscriber additions, coupled with shipments of instant streaming discs which enable subscribers to stream
content to certain consumer electronic devices and the expanded use of one month free trials. Subscriber
acquisition cost decreased primarily due to continued strong organic subscriber growth.
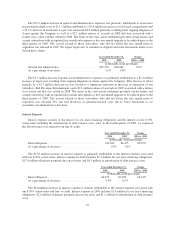
Year ended December 31, Change
2009 2008 2009 vs. 2008
(in thousands, except percentages and
subscriber acquisition cost)
Marketing .................................... $237,744 $199,713 19.0%
As a percentage of revenues .................. 14.2% 14.6%
Other Data:
Gross subscriber additions ................... 9,332 6,859 36.1%
Subscriber acquisition cost ................... $ 25.48 $ 29.12 (12.5)%
The $38.0 million increase in marketing expenses was primarily attributable to an increase of $21.4 million
in spending related to affiliates including our consumer electronics partners. The increase is also due to
an $11.5 million increase in other marketing program spending, principally in TV and radio advertising and
direct mail to promote our service. Subscriber acquisition cost decreased primarily due to momentum associated
with the launch of new consumer electronics partner devices and the broad appeal of streaming content.
General and Administrative
General and administrative expenses consist of payroll and related expenses for executive, finance, content
acquisition and administrative personnel, as well as recruiting, professional fees and other general corporate
expenses.
Year ended December 31, Change
2010 2009 2010 vs. 2009
(in thousands, except percentages)
General and administrative ............................ $70,555 $51,333 37.4%
As a percentage of revenues ............................ 3.3% 3.1%
28


