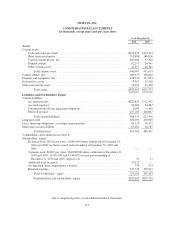
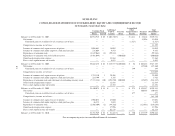
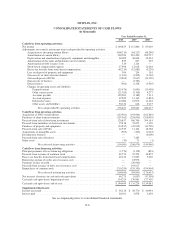
NetFlix 2010 Annual Report Download - page 57
Download and view the complete annual report
Please find page 57 of the 2010 NetFlix annual report below. You can navigate through the pages in the report by either clicking on the pages listed below, or by using the keyword search tool below to find specific information within the annual report.-
 1
1 -
2
-
3
-
4
-
5
-
6
-
7
-
8
-
9
-
10
-
11
-
12
-
13
-
14
-
15
-
16
-
17
-
18
-
19
-
20
-
21
-
22
-
23
-
24
-
25
-
26
-
27
-
28
-
29
-
30
-
31
-
32
-
33
-
34
-
35
-
36
-
37
-
38
-
39
-
40
-
41
-
42
-
43
-
44
-
45
-
46
-
 47
47 -
 48
48 -
 49
49 -
 50
50 -
 51
51 -
 52
52 -
 53
53 -
 54
54 -
 55
55 -
 56
56 -
 57
57 -
 58
58 -
 59
59 -
 60
60 -
 61
61 -
 62
62 -
 63
63 -
 64
64 -
 65
65 -
 66
66 -
 67
67 -
68
-
69
-
70
-
71
-
72
-
73
-
74
-
75
-
76
 |
 |

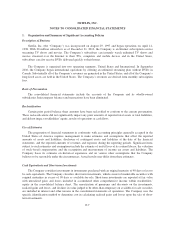
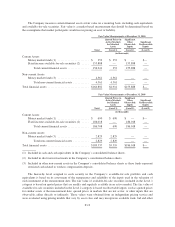
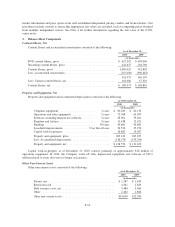
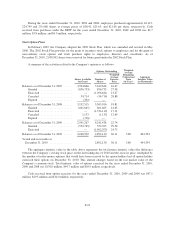
The Company measures certain financial assets at fair value on a recurring basis, including cash equivalents
and available-for-sale securities. Fair value is a market-based measurement that should be determined based on
the assumptions that market participants would use in pricing an asset or liability.
Fair Value Measurements at December 31, 2010
Quoted Prices in
Active Markets
for Identical
Assets
Significant
Other
Observable
Inputs
Significant
Unobservable
Inputs
Total (Level 1) (Level 2) (Level 3)
(in thousands)
Current Assets:
Money market funds (1) ...................... $ 353 $ 353 $ — $—
Fixed income available-for-sale securities (2) ..... 155,888 — 155,888 —
Total current financial assets ............... 156,241 353 155,888 —
Non-current Assets:
Money market funds (3) ...................... 4,561 4,561 — —
Total non-current financial assets ........... 4,561 4,561 — —
Total financial assets ............................. $160,802 $4,914 $155,888 $—
Fair Value Measurements at December 31, 2009
Quoted Prices in
Active Markets
for Identical
Assets
Significant
Other
Observable
Inputs
Significant
Unobservable
Inputs
Total (Level 1) (Level 2) (Level 3)
(in thousands)
Current Assets:
Money market funds (1) ...................... $ 690 $ 690 $ — $—
Fixed income available-for-sale securities (2) ..... 186,018 — 186,018 —
Total current financial assets ............... 186,708 690 186,018 —
Non-current Assets:
Money market funds (3) ...................... 2,829 2,829 — —
Total non-current financial assets ........... 2,829 2,829 — —
Total financial assets ............................. $189,537 $3,519 $186,018 $—
(1) Included in cash and cash equivalents in the Company’s consolidated balance sheets.
(2) Included in short-term investments in the Company’s consolidated balance sheets.
(3) Included in other non-current assets in the Company’s consolidated balance sheets as these funds represent
restricted cash related to workers compensation deposits.
The hierarchy level assigned to each security in the Company’s available-for-sale portfolio and cash
equivalents is based on its assessment of the transparency and reliability of the inputs used in the valuation of
such instrument at the measurement date. The fair value of available-for-sale securities included in the Level 1
category is based on quoted prices that are readily and regularly available in an active market. The fair value of
available-for-sale securities included in the Level 2 category is based on observable inputs, such as quoted prices
for similar assets at the measurement date; quoted prices in markets that are not active; or other inputs that are
observable, either directly or indirectly. These values were obtained from an independent pricing service and
were evaluated using pricing models that vary by asset class and may incorporate available trade, bid and other
F-13