NetFlix 2010 Annual Report Download - page 58
Download and view the complete annual report
Please find page 58 of the 2010 NetFlix annual report below. You can navigate through the pages in the report by either clicking on the pages listed below, or by using the keyword search tool below to find specific information within the annual report.-
 1
1 -
2
-
3
-
4
-
5
-
6
-
7
-
8
-
9
-
10
-
11
-
12
-
13
-
14
-
15
-
16
-
17
-
18
-
19
-
20
-
21
-
22
-
23
-
24
-
25
-
26
-
27
-
28
-
29
-
30
-
31
-
32
-
33
-
34
-
35
-
36
-
37
-
38
-
39
-
40
-
41
-
42
-
43
-
44
-
45
-
46
-
47
-
 48
48 -
 49
49 -
 50
50 -
 51
51 -
 52
52 -
 53
53 -
 54
54 -
 55
55 -
 56
56 -
 57
57 -
 58
58 -
 59
59 -
 60
60 -
 61
61 -
 62
62 -
 63
63 -
 64
64 -
 65
65 -
 66
66 -
 67
67 -
 68
68 -
69
-
70
-
71
-
72
-
73
-
74
-
75
-
76
 |
 |

market information and price quotes from well established independent pricing vendors and broker-dealers. Our
procedures include controls to ensure that appropriate fair values are recorded, such as comparing prices obtained
from multiple independent sources. See Note 4 for further information regarding the fair value of the 8.50%
senior notes.
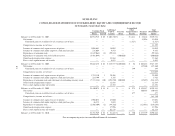
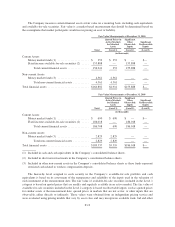
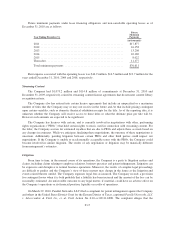
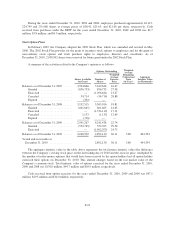
3. Balance Sheet Components
Content Library, Net
Content library and accumulated amortization consisted of the following:
As of December 31,
2010 2009
(in thousands)
DVD content library, gross ...................................... $ 627,392 $ 638,006
Streaming content library, gross .................................. 441,637 104,796
Content library, gross .......................................... 1,069,029 742,802
Less: accumulated amortization .................................. (707,050) (596,663)
361,979 146,139
Less: Current content library, net ................................. 181,006 37,329
Content library, net ............................................ $ 180,973 $ 108,810
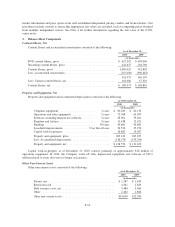
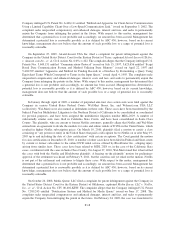
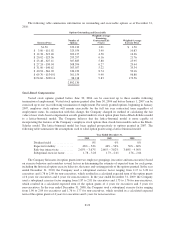
Property and Equipment, Net
Property and equipment and accumulated depreciation consisted of the following:
As of December 31,
2010 2009
(in thousands)
Computer equipment ......................... 3years $ 60,289 $ 62,132
Operations and other equipment ................ 5years 72,368 65,059
Software, including internal-use software ......... 3years 26,961 35,401
Furniture and fixtures ......................... 3years 11,438 12,421
Building ................................... 30years 40,681 40,681
Leasehold improvements ................. Over life of lease 36,530 35,156
Capital work-in-progress ................................ 16,882 15,097
Property and equipment, gross ............................ 265,149 265,947
Less: Accumulated depreciation ........................... (136,579) (134,294)
Property and equipment, net .............................. $128,570 $ 131,653
Capital work-in-progress as of December 31, 2010 consists primarily of approximately $16 million of
operations equipment. In 2010, the Company wrote-off fully depreciated equipment and software of $33.9
million related to assets that were no longer in existence.
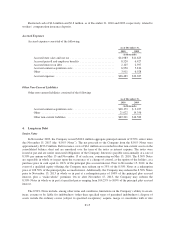
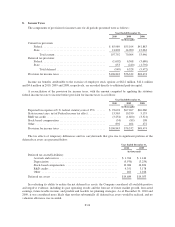
Other Non-Current Assets
Other non-current assets consisted of the following:
As of December 31,
2010 2009
(in thousands)
Patents, net .............................................. $ 1,587 $ 1,639
Restricted cash ............................................ 4,561 2,829
Debt issuance costs, net ..................................... 5,480 5,966
Other ................................................... 2,462 1,866
Other non-current assets .................................... $14,090 $12,300
F-14