NetFlix 2010 Annual Report Download - page 29
Download and view the complete annual report
Please find page 29 of the 2010 NetFlix annual report below. You can navigate through the pages in the report by either clicking on the pages listed below, or by using the keyword search tool below to find specific information within the annual report.-
 1
1 -
2
-
3
-
4
-
5
-
6
-
7
-
8
-
9
-
10
-
11
-
12
-
13
-
14
-
15
-
16
-
17
-
18
-
 19
19 -
 20
20 -
 21
21 -
 22
22 -
 23
23 -
 24
24 -
 25
25 -
 26
26 -
 27
27 -
 28
28 -
 29
29 -
 30
30 -
 31
31 -
 32
32 -
 33
33 -
 34
34 -
 35
35 -
 36
36 -
 37
37 -
 38
38 -
 39
39 -
40
-
41
-
42
-
43
-
44
-
45
-
46
-
47
-
48
-
49
-
50
-
51
-
52
-
53
-
54
-
55
-
56
-
57
-
58
-
59
-
60
-
61
-
62
-
63
-
64
-
65
-
66
-
67
-
68
-
69
-
70
-
71
-
72
-
73
-
74
-
75
-
76
 |
 |

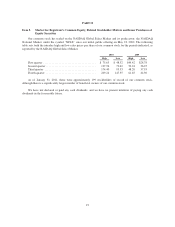
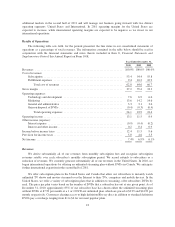
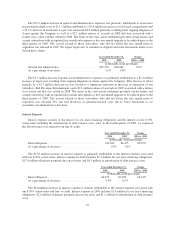
The 1.8 percentage point increase in gross margin was primarily due to lower DVD content acquisition
expenses per DVD mailed and a 22.3% decline in monthly DVD rentals per average paying subscriber driven by
the growing popularity of our lower priced plans and streaming. This decline in DVD usage was larger than the
decline in average revenue per paying subscriber of 8.3%. The resulting increase to gross margin was offset
partially by increased investments in our streaming content.
Year ended December 31, Change
2009 2008 2009 vs. 2008
(in thousands, except percentages and average monthly
gross profit per paying subscriber)
Gross profit ................................ $590,998 $454,427 30.1%
Gross margin ............................... 35.4% 33.3%
Average monthly gross profit per paying
subscriber ............................... $ 4.71 $ 4.58 2.8%
The 2.1 percentage point increase in gross margin was primarily due to lower DVD content acquisition
expenses per DVD mailed and a 6.3% decline in monthly DVD rentals per average paying subscriber driven by
the growing popularity of our lower priced plans. This decline was larger than the decline in average revenue per
paying subscriber of 3.3%. The resulting increase to gross margin was offset partially by increased investments
in our streaming content.
We have increased and expect to continue to increase investments in content, in particular streaming
content. These investments would reduce our gross margin to the extent that increases in content acquisition and
licensing expenses outpace growth in our revenues.
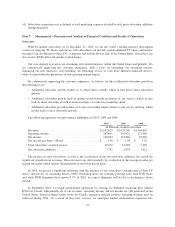
Operating Expenses
Technology and Development
Technology and development expenses consist of payroll and related costs incurred in making
improvements to our service offering, including testing, maintaining and modifying our user interfaces, our
recommendation and merchandising technology, as well as, telecommunications systems and infrastructure and
other internal-use software systems. Technology and development expenses also include costs associated with
computer hardware and software, as well as certain costs paid for third-party Internet-based or “cloud”
computing services used in connection with our business.
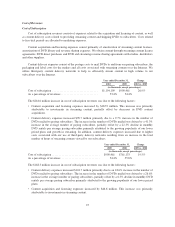
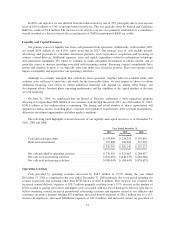
Year ended December 31, Change
2010 2009 2010 vs. 2009
(in thousands, except percentages)
Technology and development .......................... $163,329 $114,542 42.6%
As a percentage of revenues ........................... 7.6% 6.9%
The $48.8 million increase in technology and development expenses was primarily the result of a $27.7
million increase in personnel-related costs and a $14.2 million increase in facilities and equipment related
expenses. These increases are primarily due to a 21% growth in headcount supporting continued improvements
to our service. Personnel-related costs also increased due to a $5.7 million increase in stock-based compensation.
In addition, costs paid for cloud computing services increased $7.7 million.
Year ended December 31, Change
2009 2008 2009 vs. 2008
(in thousands, except percentages)
Technology and development .......................... $114,542 $89,873 27.4%
As a percentage of revenues ............................ 6.9% 6.6%
The $24.7 million increase in technology and development expenses was primarily the result of a $17.4
million increase in personnel-related costs due to 26.6% growth in headcount to develop solutions for streaming
27