NetFlix 2010 Annual Report Download - page 32
Download and view the complete annual report
Please find page 32 of the 2010 NetFlix annual report below. You can navigate through the pages in the report by either clicking on the pages listed below, or by using the keyword search tool below to find specific information within the annual report.-
 1
1 -
2
-
3
-
4
-
5
-
6
-
7
-
8
-
9
-
10
-
11
-
12
-
13
-
14
-
15
-
16
-
17
-
18
-
19
-
20
-
21
-
 22
22 -
 23
23 -
 24
24 -
 25
25 -
 26
26 -
 27
27 -
 28
28 -
 29
29 -
 30
30 -
 31
31 -
 32
32 -
 33
33 -
 34
34 -
 35
35 -
 36
36 -
 37
37 -
 38
38 -
 39
39 -
 40
40 -
 41
41 -
 42
42 -
43
-
44
-
45
-
46
-
47
-
48
-
49
-
50
-
51
-
52
-
53
-
54
-
55
-
56
-
57
-
58
-
59
-
60
-
61
-
62
-
63
-
64
-
65
-
66
-
67
-
68
-
69
-
70
-
71
-
72
-
73
-
74
-
75
-
76
 |
 |

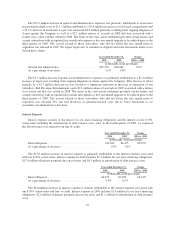
Interest and Other Income
Interest and other income consist primarily of interest and dividend income generated from invested cash
and short-term investments.
Year ended December 31, Change
2010 2009 2010 vs. 2009
(in thousands, except percentages)
Interest and other income ........................... $3,684 $6,728 (45.2)%
As a percentage of revenues ......................... 0.2% 0.4%
The $3.0 million decrease in interest and other income was primarily attributable to a $1.8 million dollar
gain realized in 2009 on the sale of our investment in a private company which we had accounted for under the
cost method, coupled with lower average cash and investment balances resulting from the repurchase of our
common stock.
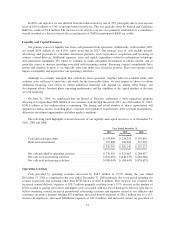
Year ended December 31, Change
2009 2008 2009 vs. 2008
(in thousands, except percentages)
Interest and other income ........................... $6,728 $12,452 (46.0)%
As a percentage of revenues ......................... 0.4% 0.9%
The $5.7 million decrease in interest and other income was primarily attributable to lower cash and
investment balances resulting from the repurchase of our common stock, and a $1.6 million decrease in realized
gains recognized as compared to the prior year. The decrease was offset by a $1.8 million dollar gain realized in
2009 on the sale of our investment in a private company which we accounted for under the cost method.
Interest and dividend income was approximately $2.7 million, $3.7 million and $9.2 million in 2010, 2009
and 2008, respectively. Interest and other income included gains of approximately $1.0 million, $1.5 million and
$3.1 million on the sale of short-term investments in 2010, 2009 and 2008, respectively.
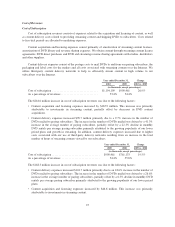
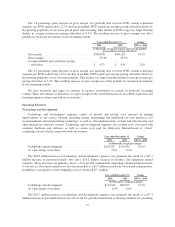
Provision for Income Taxes
Year ended December 31, Change
2010 2009 2010 vs. 2009
(in thousands, except percentages)
Provision for income taxes ......................... $106,843 $76,332 40.0%
Effective tax rate ................................. 39.9% 39.7%
In 2010, our effective tax rate differed from the federal statutory rate of 35% principally due to state income
taxes of $15.6 million or 5.8% of income before income tax. This was partially offset by Federal and California
research and development (“R&D”) tax credits of $3.3 million. Our effective tax rate for the year ended
December 31, 2010 was relatively flat as compared to our effective tax rate for the year ended December 31,
2009.
In December 2010, the Tax Relief, Unemployment Insurance Reauthorization, and Job Creation Act of 2010
was signed into law. One of the major components of this legislation is the reinstatement of the Federal R&D
Credit retroactively to January 1, 2010. As a result, we recorded a Federal R&D Credit of approximately $1.8
million as a discrete item in the fourth quarter of 2010.
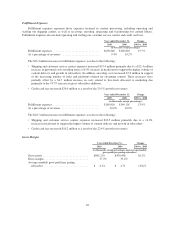
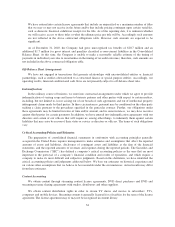
Year ended December 31, Change
2009 2008 2009 vs. 2008
(in thousands, except percentages)
Provision for income taxes .......................... $76,332 $48,474 57.5%
Effective tax rate ................................. 39.7% 36.9%
30